The Strip Graph tool is likely to be your most frequently used tool. It displays small, simple graphs in a strip to help you trace causality quickly by showing the causes or uses of a variable. The strip graph plots a single variable on each graph of the strip and shows behavior for each loaded dataset.
Strip Graph Options
You can tailor the appearance of graphs and control the amount of output with the Strip Graph Options dialog. Right-click or Control-click the Strip Graph tool to display the Strip Graph Options dialog.
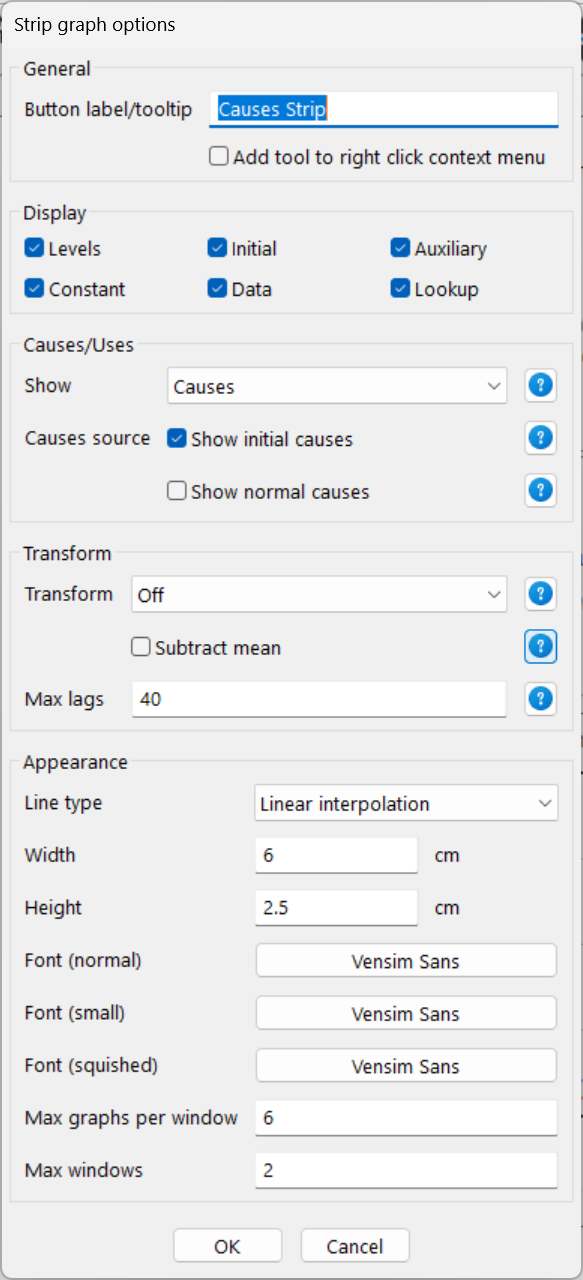
Show Link (Causes or Uses or None) determines which variables, in addition to the Workbench Variable, will be displayed.
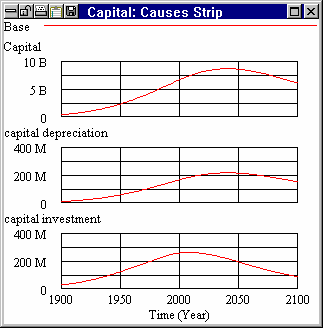
| • | Causes shows the Workbench Variable and those variables that cause it. |
| • | Uses shows the Workbench Variable and those variables that use it. |
| • | None just shows the Workbench Variable. |
Causes (Initial, Normal) determines which equations are traced when determining causes. Levels, and variables with equations using INITIAL, REINITIAL, or ACTIVE INITIAL are computed one way when they are initialized and another way as the simulation progresses. For example, suppose the equation for Water is
Water = INTEG(inflow,INIT WATER) ~~|
| • | Normal shows the path of causality during the normal simulation. Thus, if Normal were checked, the Strip Graph tool would show inflow as a cause of Water. |
| • | Initial shows the path of causality as the model is initialized. Thus, if Initial were checked, the Strip Graph tool would show INIT WATER as a cause of Water. |
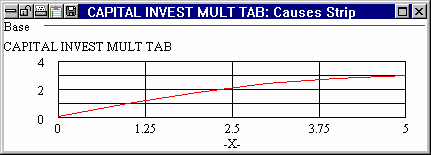
Show Types (Level, Auxiliary, Data, Initial, Constant, Lookup) determine which types of variables are displayed by the Strip Graph. Graphs are shown for Level, Auxiliary, and Data variables. Numerical values are shown for Initial and Constant variables. Mixed variables will normally appear in a graph, but will be straight lines for Constant or Initial components. Because the x-axis of a Lookup is not a Time Base, a separate Strip Graph is created for Lookups (see below):
Definition, if checked adds the definition of a variable to the right of the name. This is useful when working with models that have short variable names.
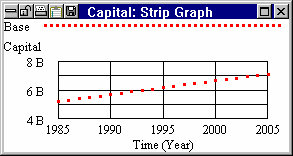
Line Type (Linear Interp, Dots Only) displays graph plots as dots or lines (see below). Linear Interpolation is usually preferable for viewing simulation results, while Dots Only is useful for reviewing data.
Transform (Off or Fourier or Autocorrelation) determines what kind of plots the Strip Graph tool generates. The Fourier graph and Autocorrelation graph are useful for reviewing periodic data and residuals.
| • | Off causes the Strip Graph tool to create plots of variables over time. |
| • | Fourier causes the Strip Graph tool to create a frequency domain plot with the x-axis labeled "Frequency." Frequency is measured in the units of the currently selected Time Base; power is measured in the square of the units for the variable. |
| • | 0 mean, if checked, subtracts the mean from the data series before computing the Fourier transform. This will remove the value that appears at frequency 0 representing the mean value and can make it easier to identify a later peak. |
| • | Autocorrelation causes the Strip Graph tool to show an autocorrelation plot for each variable. An autocorrelation plot shows the correlation of a variable with the variable's value at a previous time. The x-axis on this plot represents the number of lags, where a lag is one SAVEPER. The X axis starts at 0 where, by definition, the autocorrelation is 1.0. |
| • | Max # lets you specify the maximum number of lags to be used. By default this is 40. Larger values can be useful in looking at long term oscillatory phenomena. Shorter values might be appropriate when looking at residuals. |
NOTE Both the Fourier and Autocorrelation options change the units for the x and y axes of plots. Be careful when you interpret results.
Max Graphs Per Window is the maximum number of graphs that will appear in a single window. If too many graphs are placed in a single window, each graph is shrunk, making them difficult to read. But if only a few graphs are placed in a window, many windows might be required to display all the graphs on the screen. The current value of the maximum number of graphs per window is shown. Type in a new value or click on the down arrow to the right to select from a list of values that can be used.
Max Windows is the maximum number of windows that will be created each time you invoke the Strip Graph tool. If you need more windows than specified by this number, you will be asked if you want to see them all. This is to prevent too many windows from being created, as might happen if you use a SUM function, which creates tens or even hundreds of windows. The current value of the maximum number of windows is displayed. Type in a new value or click on the down arrow to the right to select from a list of values that can be used.
Output Strip Width is the width of the Strip Graph window. This is measured in inches or centimeters according to your selection in Tools>Options.
Output Strip Height is the height of the individual graphs (excluding labels) within the Strip Graph output window. If the graph would be too big to fit on the screen, Vensim will adjust this height.
Fonts (Normal, Small and Squished), lets you set the fonts that will be used for output. The normal font is used if there is sufficient room, if not the small font is used. If using the small font does not leave enough room, the squished font is used.
Strip Graph Output
Clicking on the Strip Graph icon generates one or more windows that show plots of the Workbench Variable and — depending on the settings — its causes or uses. If a Workbench Variable is subscripted, and more than one subscript is selected, Vensim reports multiple values for this variable. If more plots than will fit in a single window are required, multiple windows will be created, subject to the settings of the Max Graphs Per Window and Max Window options.
NOTE Strip Graph is the only tool that creates more than one window for a single invocation. Since each window is a separate tool output window, you can delete them selectively, leaving just the ones you need.
A strip graph has an active X-axis that you can use to set the global Start time and End time by shift dragging over a range.
NOTE You cannot adjust the Start time or End time using plots of Lookups, autocorrelation plots, or Fourier plots, because these types of plots do not have a Time Base for the X-axis.