Vensim is designed to easily incorporate any data that may be available. This chapter:
| • | Discusses the format for data used in Vensim. |
| • | Shows how data can be imported from spreadsheets. |
| • | Describes how data can be used in models. |
| • | Provides hints on how to manage and manipulate data. |
The use of data as described here is not supported in Vensim PLE.
The term data, as used in this chapter and throughout most of this manual, refers to quantitative, usually measured, values associated with particular times. Knowledge and analysis going into model development, equation writing, and parameter selection are not part of this narrow definition of data.
Overview
See also: User Guide, Chapter 16 - Using Data in Models
Kinds of Data
"Data" in this chapter primarily refers to time-series data. A model actually embodies a much richer dataset of less-formal information, including subject matter expertise, Reality Checks, and dimensional consistency and conservation constraints. Numerical data may also be included via constants and lookups.
Uses of Data
There are two ways to use time series data in Vensim. For either purpose, data may be transformed in data equations.
In addition, non-time-series constants and lookups can be used to initialize stocks and parameterize model behavior.
1. Comparison
Data can be used for comparison with simulation results. This can be done manually by looking at graphs and tables, as for reference modes, or automatically during optimization via a payoff file.
•The simplest way to compare model results with data is to use the same names for model variables and data series. If you then import the data and simulate the model, any time you bring up a graph or table of a model variable that is also contained in the data, you will see values for both. When you import a dataset, it is automatically loaded for use in creating graphs and tables.
•If you have different names for model and data variables (e.g., "price" and "price data"), you can still compare them by creating custom graphs.
2. Driving the Model
Data can be used as a time-varying input that drives other behavior in a simulation model. This requires that you have a data variable populated with exogenous data from a .vdf file, GET function or ODBC, so that you can refer to the variable in equations.
•To use data to drive the model, name the data series with the same variable names as the exogenous (data) variables in your model. Either write an equation for the data variable using the GET 123 DATA function or the GET XLS DATA function or, import the data into Vensim and in enter the name of your imported data file in the Data Sources field of the Advanced Tab of the Simulation Control dialog.
Getting Data into and out of Vensim
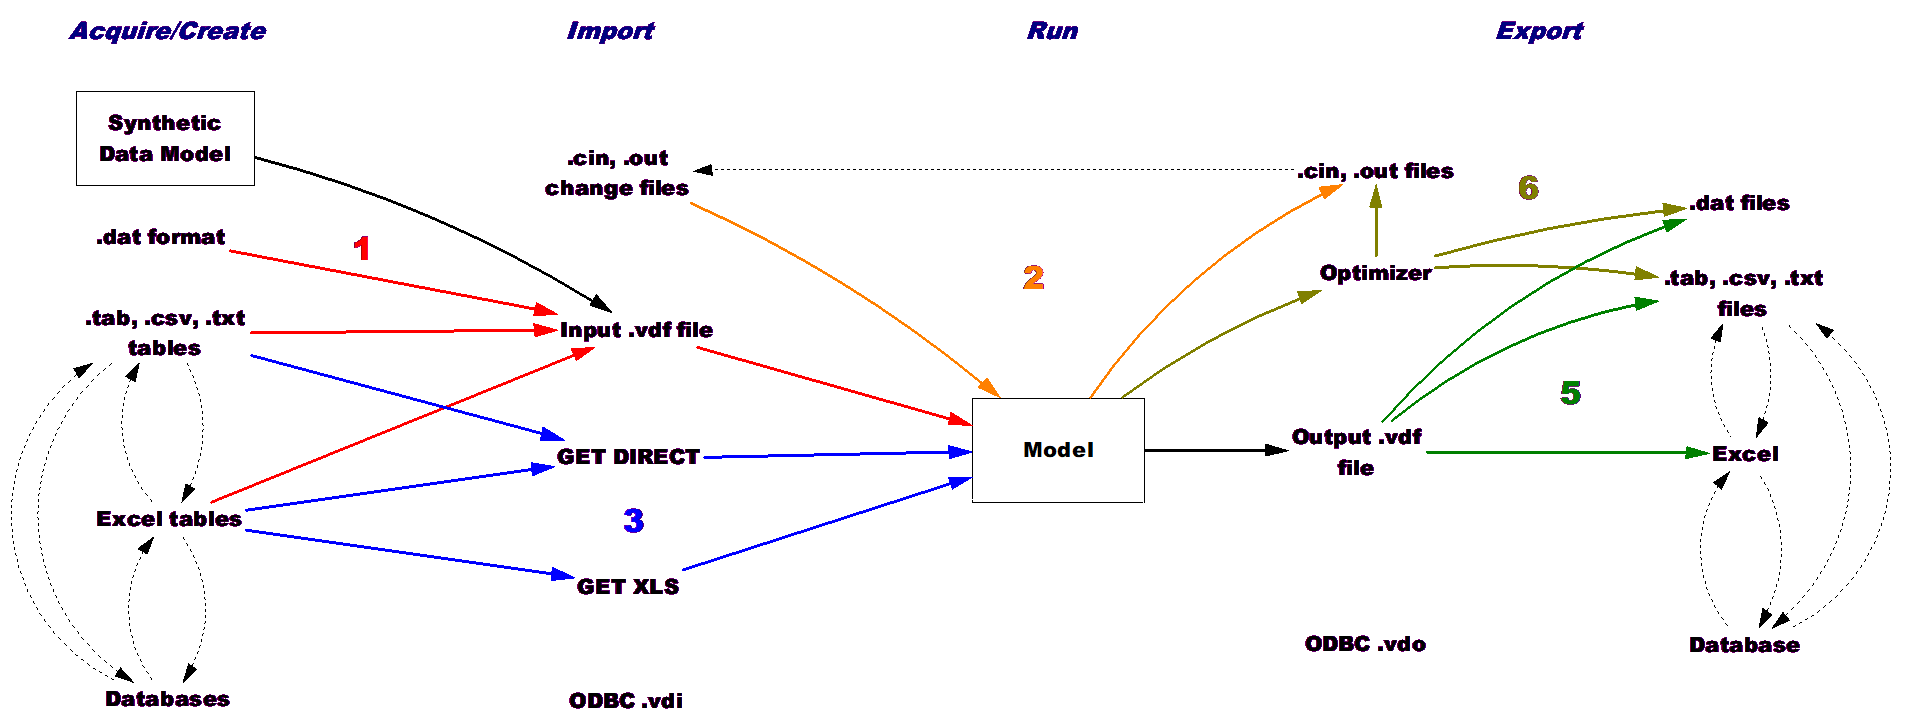
For all uses of data, the methods you use to format and import the data for Vensim's use are the same. There are many options:

1. Imported dataset
Importing a data file creates a .vdf dataset that can be read by a model as comparison data or sources for data variable values. The Model>Import Dataset... and from .dat format... menu options provide access to most common formats.
Data need not originate as files from primary sources; you can also create synthetic data. Build a model representing a system of interest, adding noise to simulate real-world disturbances and measurement error. The output of that model is a .vdf dataset that can be used directly as input by another model.
Similarly, a .vdf dataset can be opened as a model. It won't have a diagram, but it will be populated with data variables. You can then modify the dataset-model and use it as the basis for creating the data inputs to your simulation model.
Command scripts provide automation and additional import format options. See:
A command script can be specified on the pre/post tab of the simulation control dialog to provide for automated export every time the model is run.
2. Changes files
Constants and lookups may be read from and written to changes files, usually in .cin format:
•From the simulation control dialog
•From the Synthesim toolbar
The optimizer produces .out files, containing final parameter results, that may be read like .cin files.
3. GET functions
The GET functions provide direct access to files for import of data, constants and lookups. There are two primary variants: GET DIRECT and GET XLS. The GET XLS functions read from an open Excel spreadsheet, and therefore include users' changes whenever a run is started. The GET DIRECT functions, on the other hand, read from the saved version of input files, and do not require Excel at all. See:
•GET XLS CONSTANTS, GET XLS DATA, GET XLS LOOKUPS, GET XLS SUBSCRIPT
•GET DIRECT CONSTANTS, GET DIRECT DATA, GET DIRECT LOOKUPS, GET DIRECT SUBSCRIPT
4. ODBC
Databases may be read from and written to directly. See the ODBC chapter.
5. Exported dataset
Run output in a .vdf dataset, including sensitivity results, can be exported to a variety of formats. Many of these are available from the Model>Export Dataset... menu.
Command scripts provide automation and additional formatting options. See:
A command script can be specified on the pre/post tab of the simulation control dialog to provide for automated export every time the model is run.
6. Output files
The optimizer produces .out files, containing final parameter results, that may be read like .cin files (see above).
The optimizer also may generate a variety of .dat and .tab format files containing sensitivity and trace output and the MCMC sample and statistics. These may be used directly, or imported to .vdf format for viewing in Vensim.
Organizing Data & Data Models
Obviously there are many additional ways to transform and organize data before Vensim sees it. A series of text-based tables can be consolidated in a spreadsheet or database, for example. Due to the diversity of real-world data, it is often helpful to use several of the above methods to get data into a model.
When the data collection and transformation becomes complex, it may be useful to create an intermediate data model that aggregates various sources, performs needed transformations (e.g., units changes), and creates a single .vdf dataset that can be read by the main simulation model. There are several advantages to doing this:
•It reduces clutter and computational load in the main model.
•If the model is to be distributed, only the data.vdf needs to be included; the source files and data model can be omitted for simplicity.
Typically, only the time series data will be aggregated in the data model; constants and lookups continue to flow directly to the main simulation model.
