The MCMC/SA algorithm can produce six kinds of output:
•a sample of accepted points,
•a diagnostic table of all points (except those that are rejected),
•statistics of chain values and convergence
•marginal and joint distributions, and
•(when used as a payoff sensitivity method), confidence bounds on parameters.
All of these files can be imported to .vdf format for viewing in the model. The .tab files are convenient for reviewing in a spreadsheet. The points and statistics files contain additional variables, which can be seen by opening the .vdf as a model.
If you run very long simulations with many parameters, these files may grow very large.
Note: as of version 10.4, .dat and most .tab files can be loaded directly in the Dataset Control.
Sample
A tab-delimited file, named myrun_MCMC_sample.tab, listing all accepted points and payoffs (after the optional burnin period). You may use it as a File method input to sensitivity runs, so that you can explore the response of variables in your model subject to the posterior probability from the calibration.
Note that MCMC does not accept a new point every iteration, so repeated points are common. These are important to the statistical properties of the sample, but if you are using MCMC heuristically, you can suppress repeats with the MCRECORD option.
If you don't want to waste subsequent simulations on identical samples, you can generate a large sample with MCMC, then downsample it to a smaller set, which will have a low probability of repeats.
SIMULATION PAYOFF |
varname 1 |
varname 2 |
varname 3 |
# |
# |
# |
# |
# |
# |
# |
... |
Note: SIMULATION PAYOFF is included as of v10.3. This is a new reserved variable name. It will be ignored when the sample is used for sensitivity runs.
The following example shows the sample resulting from standalone MCMC (red) and payoff sensitivity MCMC (blue). In the case of payoff sensitivity, the sample is truncated at the 95% confidence level, showing the characteristic elliptical shape of this bivariate normal distribution.
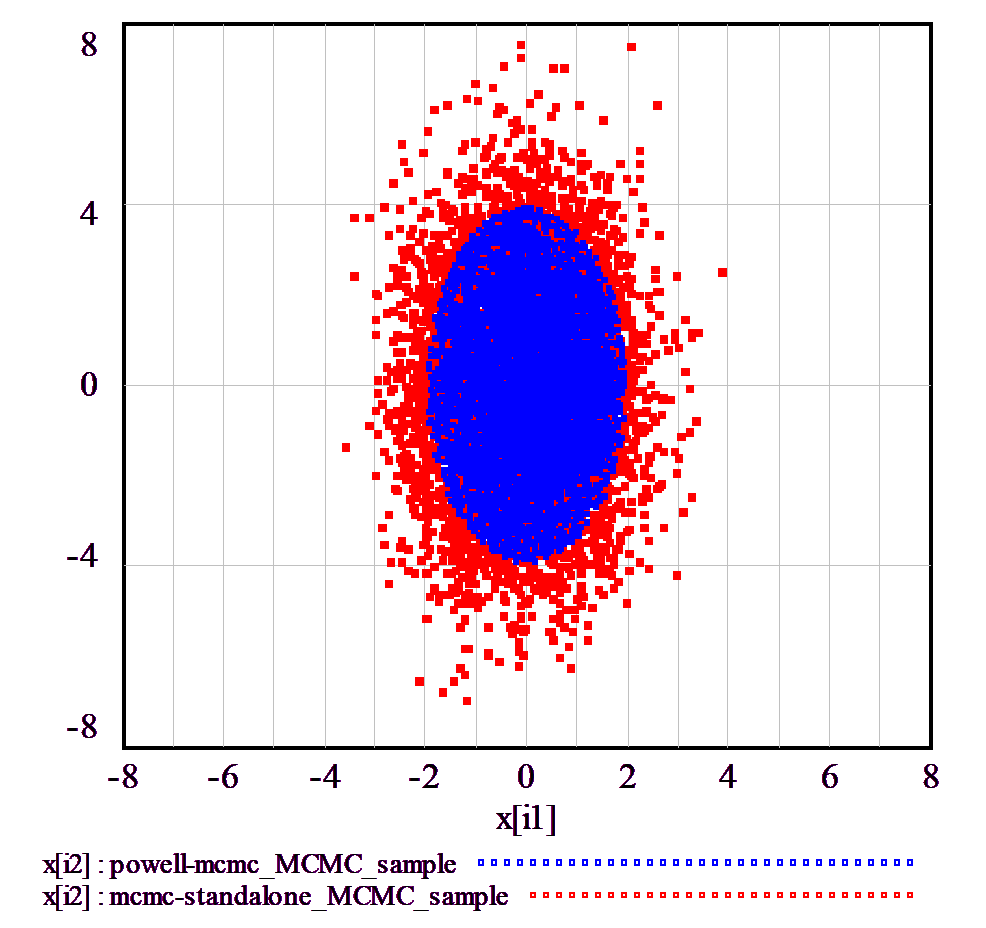
The standalone MCMC sample has the mean and variance of the target distribution, including some points (not coincidentally, about 5%) that lie outside the 2-sigma 95% confidence bounds. The payoff sensitivity MCMC sample is the same inside the 95% bounds, but is truncated, so its total variance is less.
Sample Sensitivity Control
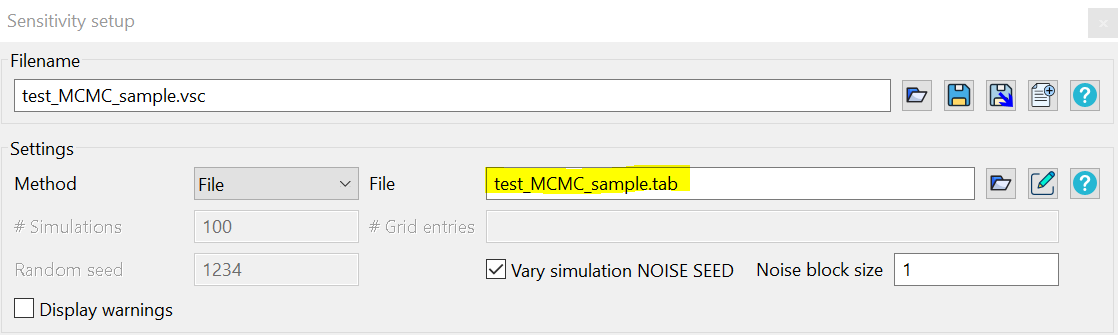
Accompanying the sample .tab file is a sensitivity control file (.vsc) that you can immediately use to perform a sensitivity run using your parameter sample.
The file initially points to your runname_MCMC_sample.tab file, but you can also use it with the runname_MCMC_clust.tab file (see Clusters below).
See the Sensitivity File Option for further detail.
Points
A tab-delimited file, named myrun_MCMC_points.tab, listing all accepted points and payoffs.
Iteration |
Payoff |
Chain |
Status |
varname 1 |
varname 2 |
varname 3 |
varname 4 |
1 |
# |
1 |
0 |
# |
# |
# |
# |
2 |
# |
2 |
0 |
# |
# |
# |
... |
Status codes are as follows:
| -2 | Payoff error (e.g., an FP error or negative payoff that should represent a likelihood) |
| -1 | Rejected |
| 0 | Initial |
| 1 | Accepted |
| 2 | Repeated |
| 3 | Accepted during burnin |
| 4 | Repeated during burnin |
| 5 | Accepted, but above payoff sensitivity threshold |
| 6 | Repeated, but above payoff sensitivity threshold |
| 7 | Improvement on best payoff (this will duplicate a point reported as 0-6) |
Statistics
A .dat file, named myrun_MCMC_stats.dat, containing additional diagnostics. It includes:
•Chain acceptance rates.
•Flags for outlier chains.
•Global mean and variance across all chains.
•Global acceptance rate. The optimal acceptance rate for Normal distributions is about .24 under some conditions, though this is unlikely to hold in most models. An acceptance rate near 0 or 1 likely means that the proposal distribution is not generating viable points, or is too conservative, respectively. Either way, progress will be slow.
•Means and variances for pooled metachains.
•Best payoffs and improvements.
•The grand mean and variance between chains, and the mean of chain variances over iterations.
•The Rhat statistic. This compares variance across chains and within chains over iterations to indicate the extent to which additional iterations might improve the ratio of variances. Rhat should approach 1; values in excess of 1.01 to 1.1 are typically regarded as unconverged. Typically, the number of parallel chains in a simulation is large (at least 10, possibly 100s), so these are aggregated into a smaller set of metachains before the statistic is computed.
oThis is a variant of Aki Vehtari, Andrew Gelman, Daniel Simpson, Bob Carpenter, Paul-Christian Bürkner (2019): Rank-normalization, folding, and localization: An improved Rhat for assessing convergence of MCMC. arXiv preprint arXiv:1903.08008
oCurrently splitting is implemented, but not folding and rank normalization.
oNote: previously Vensim reported the univariate Rubin/Brooks-Gelman PSRF convergence statistic. Rhat is roughly Sqrt(PSRF) and therefore Rhat is expected to be closer to 1. However, there are other computation differences. Stephen P. Brooks; Andrew Gelman, Journal of Computational and Graphical Statistics, Vol. 7, No. 4. (Dec., 1998), pp. 434-455.
•A CMCP convergence statistic. This is a modification of the Rosenbaum cross-match permutation test. The value reported is a P-value of a Χ2 test for the uniformity of minimum distances for members within and between a current sample and a stored sample of points. At convergence, this should be uniformly distributed, and pass (exceed 5%) 95% of the time. The CMCP sample includes only accepted points, not repeats, so it may be misleading if the acceptance rate is varying substantially. Rosenbaum, P.R. (2005). An exact distribution-free test comparing two multivariate distributions based on adjacency. Journal of the Royal Statistical Society: Series B, 67, 515-530.
•The number of parameter dimensions that may have collapsed variance (indicated by 0 interquartile range)
Note: you may see a few duplicate-point warnings when importing the statistics file. This is expected; it occurs when more than one chain improves the best solution within an iteration. The loss of information is inconsequential.
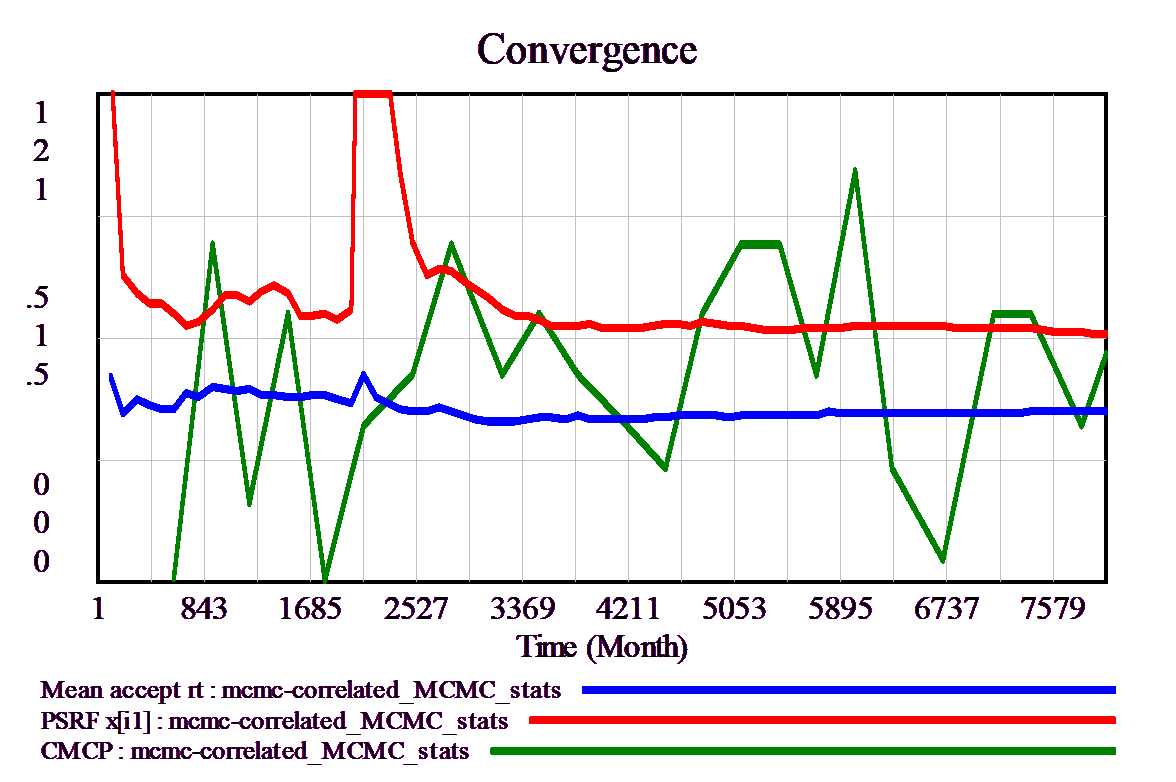
The following shows healthy convergence, with PSRF close to 1, a reasonable acceptance rate (about .3), and CMCP seldom outside 5%-95%.
Marginal Distributions
Runname_MCMC_dist.tab contains the marginal distributions of the parameters in the sample and at points along the way, for quick diagnostics.
Clusters
Runname_MCMC_clust.tab contains a k-means clustering of the samples, for use as a downscaled representative of the full sample. This is useful for exploring the variation in the sample in individual or sensitivity runs, without generating an overwhelming amount of output.
The clusters are computed with rank-normalization along each parameter direction to avoid undue influence from extreme values. Clusters are means, but the reported points are the nearest actual simulation to the cluster mean, in order to avoid problems with integer-quantized variables or other nonlinearities.
Clusters are weighted according to membership; the weight is in the SIMULATION WEIGHT column. In the future this will permit weighted sampling in sensitivity runs.
Caveat: this feature should be considered experimental for now. In the future we expect to implement improved algorithms that do a better job of preserving tails and other features of the sample.
Payoff Sensitivity (Confidence) Bounds
(Payoff sensitivity only) a tab-delimited file, named myrun_sensitive.tab, listing parameter confidence bounds.