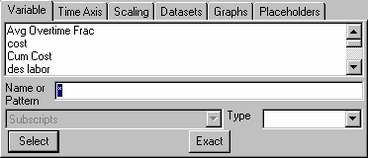
The Dataset Analysis Tools in Vensim display data over time. The Time Axis tab of the Control Panel lets you control the range and labeling of the time axis as it used by these tools.
Time Base (Not PLE or PLE Plus) displays the currently selected Time Base. Clicking on the down arrow to the right of Time gives you a selection of other valid time bases in the model. The time base is used to label the Horizontal Axis of graphs and the first row of tables. Variables defined using the TIME BASE function are available for selection here. By default, Time is the only Time Base.
As Date (Not PLE or PLE Plus), if checked, causes Time value in graphs and the Table Tool to be displayed in the date format specified in the Time Bounds tab of the Model Settings dialog. Note that if you have more than 1 Time Base be sure that you select the Time Base matched to the date settings you have chosen. Changing the Time Base will change the dates displayed to something that is likely not correct.
Changing the Time Range
Graphs and tables use the time range to determine how much of a simulation run to display. Changing the time range allows you to focus on specific events or periods for detailed analysis. There are three components to the time range: Start time, End time, and Special time. The Graph, Strip Graph, and Gantt Chart tools use Start time and End time. The Table, Bar Graph, and Document tools report values at Special time.
To decrease the value of Start, Special, or End time, click the decrease arrow indicator <-. To increase a value, click the increase arrow indicator ->. The current value (corresponding to Start, Special or End time) is displayed below these indicators and will be changed accordingly. You can also directly type in a value for any of these times. As you type the graphic time bounds display will be updated. If you type in an invalid value it will be ignored (thus if time ranges from 1900 to 2100 and you type 200 nothing will happen, but when you type the final 0 the controls will adjust).
These bounds can also be changed with the mouse. To change Start time click the mouse over the left edge of the time bar and drag it. The bar will move with the mouse. To change the End time, click the right edge of the bar and drag. As you change the Start or End time, the number displayed below the corresponding indicators will change. If you drag Start time above End time, or vice versa, Vensim will switch to changing the other one.
You can also change Special time by dragging the small box underneath the highlighted rectangle above the time values. As you drag, Special time changes.
In addition to using the Time Axis Control window, you can modify Start time and End time from the graphical output windows (from the Graph, Strip Graph and Gantt Chart tools) by Shift-clicking inside of the graphs. See "Selecting a Time Range" for more details.
Reset to Full Range resets the time range to the full range over all runs (the union of all time ranges), and sets Special time to End time. If simulations that include data are loaded then clicking on Reset to Full Range multiple times can be used to toggle between the simulation bounds, and the data bounds if they are bigger.
Display Time Base Name, if checked, causes the name of the Time Base to be displayed at the bottom of graphs and as the label for the first row of tables.
Display Time Base Units, if checked, causes the units of Measure for the Time Base to be displayed at the bottom of graphs and as the label for the first row of tables. If Display Time Base Name is also checked the units will follow the name of the Time Base in Parenthesis as in Time (Month).