
The Document tool allows you to review the equation, definition, units of measure, and selected values for a variable. This information is often required to understand why a variable functions as it does, given the inputs. The Document tool also allows you to document portions of a model, variables of particular type, or even an entire model.
Document Options
In addition to the standard options, the Document tool allows you to select what information you want to see for a variable, and in what format.
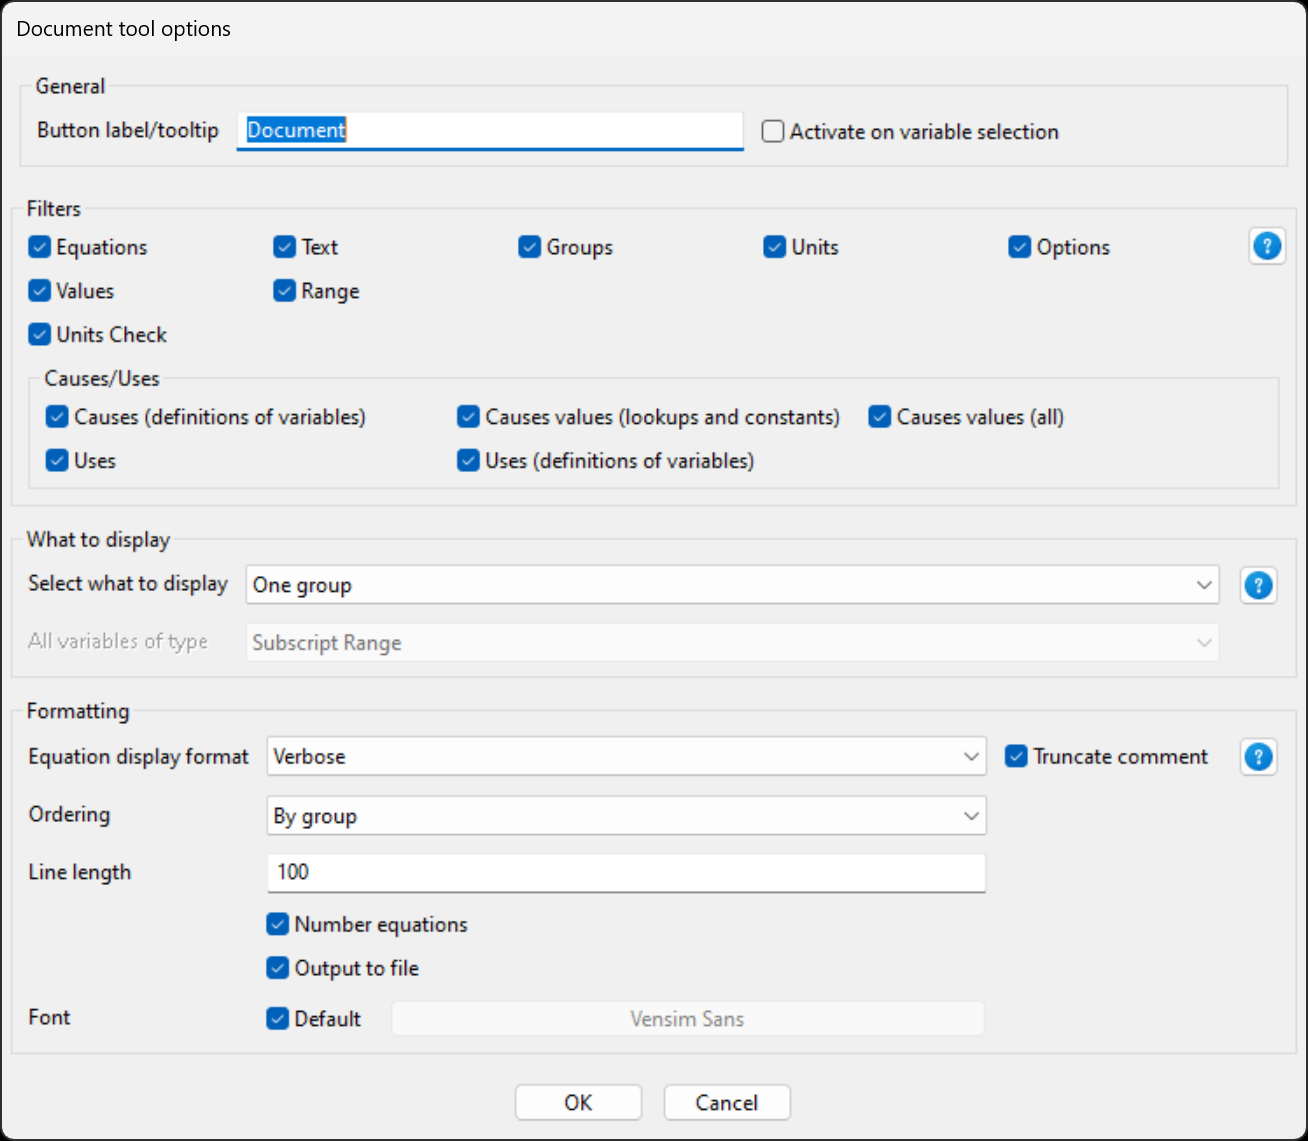
Filters allows you to select what information you want to see displayed. You can select any combination of the options you wish.
| • | Equations, if on, shows the equation(s) for the variable. If the variable is subscripted, then the equation(s) appropriate to the currently selected subscripts are shown. |
| • | Text, if on, shows the comment field for the variable. |
| • | Range, if on, prints the low and high range values for the variable. |
| • | Groups, if on, lists the group(s) that the variable is a member of. |
| • | Options, if on, shows any optional flags that can be defined for the variable. |
| • | Units, if on, shows the units for the variable. |
| • | Units-Check, if on, checks the equation(s) for the variable for units consistency. (The Units Check command checks all equations in the model. This option checks only the particular equation you are reviewing. This can be handy when correcting units problems and chasing down propagation errors.) |
| • | Values, if on, shows the value of the variable at Special time in the first loaded dataset. (If there is no value for the variable in the first dataset two dashes -- are displayed.) |
| • | Cause-Lkup-Cnst, if on, shows the values of Lookups and Constants that are inputs to the equation. Values are taken from the first loaded dataset and dashes -- are displayed when no values are available. |
| • | Cause-Active, if on, shows the values of non-constants that are inputs to the equation. Values are taken from the first loaded dataset at Special time. |
| • | Cause-Def, if on, shows the definitions for the variables appearing in the equation. |
| • | Use, if on, shows the where the variable is used. |
| • | Use - Def, if on, shows the definitions of the variables in which the current variable is used. |
Formatting (Original or Terse or Verbose) determines how equations are displayed.
| • | Original displays equations with the same spacing and punctuation you used to created them. |
| • | Terse outputs equations in a compact, essentially line-wrapped format. When this option is selected the Document tool tries to minimize the space needed for the equation. |
| • | Verbose outputs equations in a stylized and readable, albeit bulky, format. |
| • | Shorten comment, if on, removes all excess spaces and carriage returns in the comment. |
Line Length (default 75) determines the number of characters used in an editor line. This can be set to any number between 25 and 512. Use large numbers if you want to paste the output to a word processor for additional formatting.
Font... lets you set the Font to be used for output.
What to display allows you to document multiple equations within the model. This is useful for printed documentation to be provided as a supplement to reports and similar works. By default Multiple Equation Options are turned off. You can also select to document:
| • All Vars shows all variables in the model. |
| • | One Group documents all variables in a group. If you select this option you will be queried for the group to document. This makes it straightforward to document part of a model. You can, in this way, document different Views of a model by using the Edit>Act on Selected>Group command in the Sketch Editor, then documenting by Group. |
| • | All of Type documents all the variables in the model of a particular type. The type that will be documented can be selected from the combo box at the right. |
If you are documenting multiple equations you can also choose the following options:
| • Number Equations, if on, creates an equation number for each variable in the model. The equation numbers increase by 1 for each variable in the model in the order they are documented. |
| • | Output to File, if on, outputs the documented equations to a file. For large models this is faster than outputting it to an output window. Also, output to a window can be truncated if there is too much of it. |
| • | Ordering determines how the variables will be put out when they are documented. As Entered will retain the original document order — this option is most useful if the model was built using the Text Editor. Alphabetic will order the equations alphabetically. By Group will order the Groups alphabetically and within each Group order the variables belonging to that Group alphabetically. Comp will order the equations as the are computed starting with macro definitions, then String variables, then Data variables, then Level and Initial variables, then Auxiliary variables. In this way, normally, as you read down the documentation each variable that is used has already been defined (this breaks down with SIMULTANEOUS function and element by element ordering of subscripted equations). |
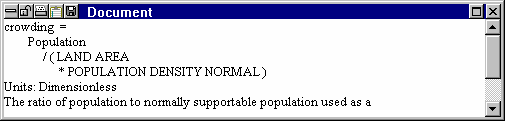
Document Output
Vensim creates a window the first time you invoke the Document tool. Successive invocations add information to this window. You can scroll the window to review information from previous invocations. If you have more than one Document tool in the Analysis Toolset, each tool displays output to a different window.
NOTE If you change the Output Font for the Document tool and you already have output from the tool open you will need to close the output before the font change will take effect.
The Document tool finds the equations for subscripted Workbench Variables by referring to the subscript selection lists. Only the relevant equations are displayed.
Vensim formats equations in the document window according to your setting of the Formatting option. A row of asterisks ************* separates equations to make them easier to read.
If no datasets are loaded, the value options are ignored and no message is given. When values are reported for dynamic variables, they are always taken from the first dataset and reported at Special time, which you can change from the Time Axis tab of the Control Panel. If you have a dataset loaded, but no values for a variable are found, two dashes -- are displayed.