![]()
![]()
![]()
The Tree Diagram tool creates a graphical representation of the structure of a model associated with the selected Workbench Variable. The Tree Diagram tool provides you with an easy-to-read, graphical representation of the causes and uses of variables. The Tree Diagram displays structural relationships (and not simulation results) and can therefore display information about a complex structure in a relatively small space.
The Tree Diagram tool is especially useful for general orientation and as a memory jogger.
Tree Diagram Options
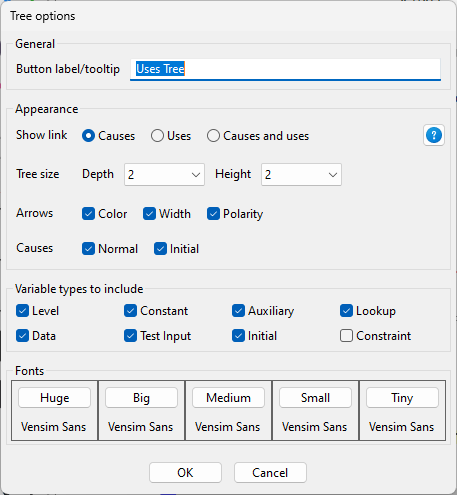
Show Link (Causes or Uses or Both) determines whether the Tree Diagram tool will show the causes, the uses, or both the causes and uses of a variable. If you choose Causes, the tree diagram grows from right to left. If you choose Uses, the diagram grows from left to right. If you choose Both the causes grow to the left and the uses grow to the right. The icon for the Tree Diagram tool reflects your choice.
Causes (Normal, Initial) determines which equations are traced when determining causes. Levels, and variables with equations using INITIAL, REINITIAL or ACTIVE INITIAL, are computed one way when they are initialized, and another way as the simulation progresses. For example, suppose the equation for Water is
Water = INTEG(inflow,init water) ~~|
| • | Normal shows the path of causality during the normal simulation. Thus, if Normal were checked, the Tree Tool would show inflow as a cause of Water. |
| • | Initial shows the path of causality as the model is initialized. Thus, if Initial were Checked, the Tree Tool would show init water as a cause of Water. |
Show Types (Level, Auxiliary, Data, Initial, Constant, Lookup, Test Input, Constraint) determines what variable type will be shown on the Tree Diagram. This option allows you to filter for specific variable types. For example, selecting only Level will show the true dynamic structure. The Workbench Variable, regardless of its type, will always be shown. If you don't select all types, the causes of types that are not selected will still be searched and the connections marked with a line as discussed in output.
Fonts (Huge, Reg, Med, Small, Tiny) lets you set the fonts for display output. These should be increasing in size from Tiny to Huge. The tree tool will attempt to output in the regular font, if this fails because of size it will successively try Med, Small and Tiny. If, even using Tiny, it cannot fit the tree it will give up and report that it cannot display output. Huge is used when you resize a tree output window to larger than original size.
Attributes (Color, Width, Polarity) will attempt to retain the attributes for the link that exist in the sketches defining the link. If any of these are checked all of the views, in the order they are listed in the view selection menu, will be searched. If these Views contain the defined link the Color, Width and Polarity will be retrieved from that link. For larger models this can slow things down significantly.
Tree Depth [default 2] lets you choose the depth to which you want to see the causes or uses. For example, with Causes selected, a depth of 1 indicates that you want to see just causes, a depth of 2 indicates that you want to see causes and the causes of causes. You can type in a depth, or select a depth by clicking on the down arrow to the right. The largest selectable depth is 999, which generally displays the structure of the entire model.
The second value to the right of the drop-down box is used only if you have elected to show both causes and uses. In this case causes are displayed to the depth displayed in the drop-down box, and uses to the depth typed in to the box to the right.
Tree Diagram Output
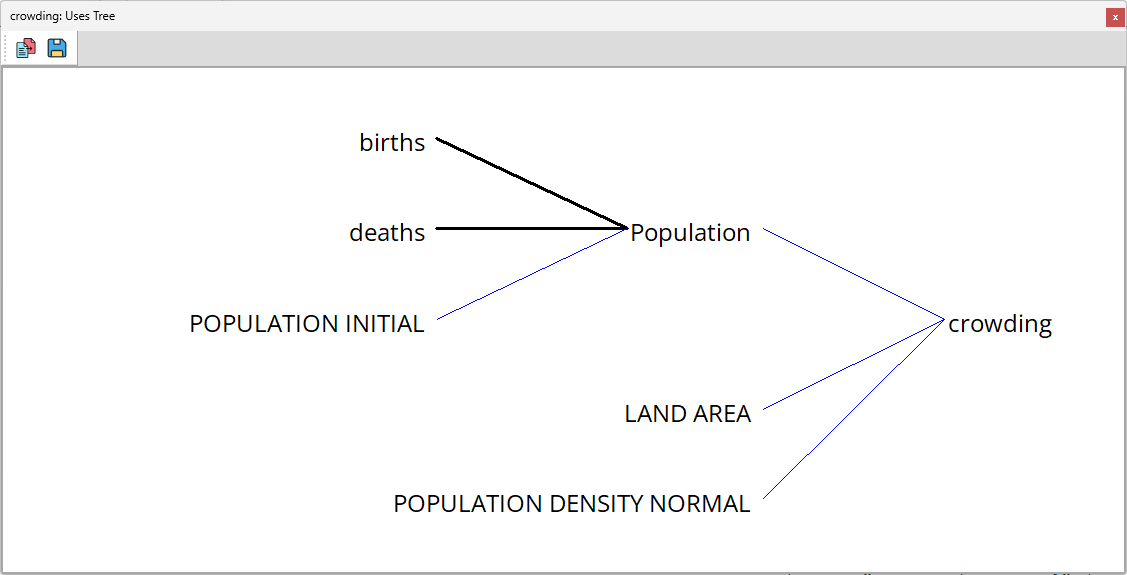
Each time you invoke the Tree Diagram tool a new window is created. This window displays the causes or uses of a variable as a tree branching from the right for causes or from the left for uses. A variable name in parentheses ( ) means that the variable appears elsewhere in the same diagram (indicating a feedback loop) and its further causes or uses are not shown. If you have set Capitalize by Type in the Global Options dialog, variable types are denoted using different case mixtures.
This is the output of the Tree Diagram tool for the model world.mdl when crowding is the Workbench variable.
If a branch passes through variable types that are not selected to a variable type that is selected, the branch is collapsed, showing the selected types as directly connected, but with a cross in the line. For example, unchecking all variable types except Levels and increasing the depth on the previous diagram to 5 gives:
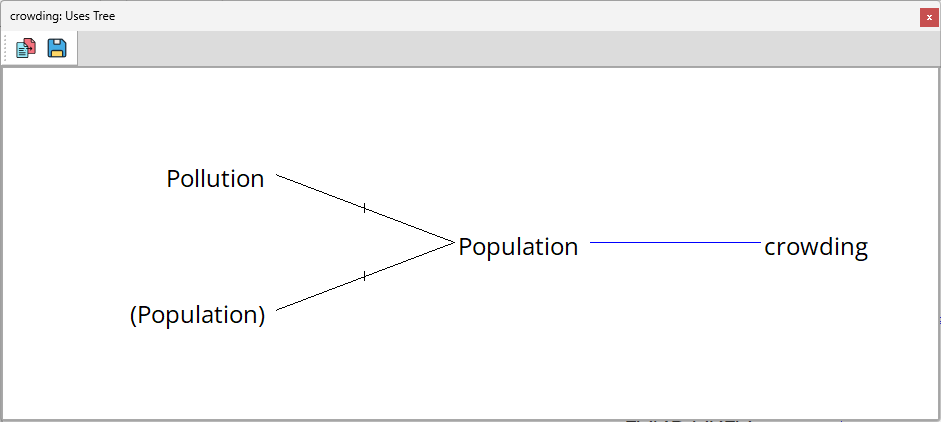
Note the parentheses ( ) around the second occurrence of Population in this diagram.
If the Tree Diagram tool is too large to be displayed clearly on the screen, you will be asked if you want to see it anyway. Depending on your relative printer/screen size, it might still be possible to print such a Tree Diagram. Note that when printing a Tree Diagram, Vensim will always put the whole diagram on a single page.
NOTE The Tree Diagram tool ignores subscripts. It operates on the Workbench Variable and selects causes and uses from the union of all possible causes and uses, for all subscript values.