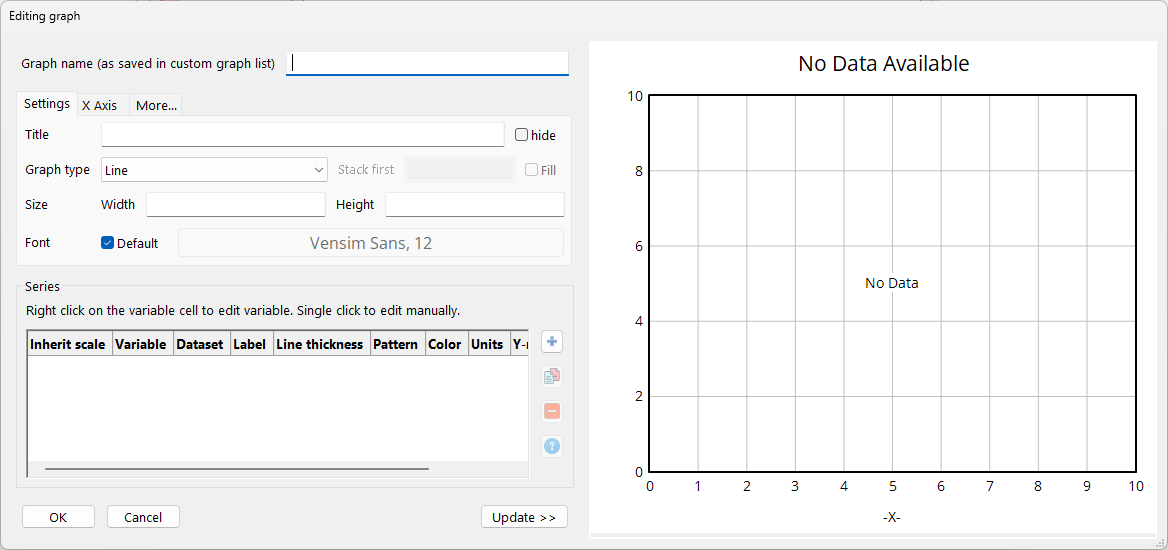
The Custom Graph Editor is a dialog that allows you to enter and modify Custom Graph descriptions. It is invoked from the Graph tab of the Control Panel, or from a graph tool configured to define a custom graph on Invocation.
The top line states the name given to this graph as it appears in the Graph tab of the Control Panel. The default naming scheme is to use the beginning of the title of the graph or, if that is blank, GRAPH_0, GRAPH_1 and so on, but you can type in another name. If you do type in a name the name will be checked to be sure it is not the same as an existing graph name. If it is you will be given a message and asked to pick a new name. Graphs are invoked by name, and the name must be unique.
Hide allows you to hide elements of the graph to reduce clutter and increase the amount of the graph devoted to displaying out.
| • | Title, if checked suppresses the title that appears above the graph proper. |
| • | X Label, if checked, suppresses the label on the X-axis. |
| • | Legend, if checked, suppresses the legend. If there are a large number of runs or variables to be graphed the legend can get very large and make the area available for the actual graph unreasonably small. |
Title is the title that will appear above the graph if it is not suppressed. Type in any title you want, or leave this blank (a blank title is not automatically suppressed).
X-Axis specifies the variable to be used on the X-axis. If this is left blank the currently selected Time Base (usually Time) will be used. To get X-Y plots enter a variable that is not a time base. You can use the Sel button to the right to get the Variable Selection dialog and choose from a list.
X-Label sets the label that will be used on the X-axis. Normally this is just the name of the X-Axis variable. You can, however, type in anything you want.
X-min specifies the minimum value the X-axis takes on. If left empty, Vensim uses the value specified in the Time Axis control, possibly rounded down. Values of a variable you enter here will be used as entered without rounding.
X-max specifies the maximum value on the X-axis. If left empty Vensim uses the value specified in the Time Axis control, possibly rounded up. This value will be used as entered without rounding.
X-divisions lets you set the number of divisions made along the X-axis (there will be one less vertical line than there are X-divisions). If this is left blank a number of X-divisions that allows the selection of round numbers as the X labels will be chosen. If this is set to -1 the number of divisions specified in the Scaling tab of the Control Panel will be used.
Lbl-Intervals, if checked, causes the X-axis labels to be placed on the intervals between vertical lines instead of on the lines. This is useful for annual data, where the interval represents events during a year.
Y-divisions lets you set the number of divisions along the vertical axis. If this is left blank the value of Y-divisions in the Scaling control will be used.
Stamp specifies the stamp that will be printed in the lower right corner of the graph when it is printed. This does not influence the appearance of the graph on the screen.
Comment specifies the comment that will be printed below the graph when it is printed. This does not influence the appearance of the graph on the screen.
Norm, Cum, Stack determines the type of graph that will be displayed. Cumulative graphs (Cum) show the integration of the output values instead of the output values themselves. Stack graph show the first variable, then the first plus the second and so on. Note that only variables with the same scale are stacked, so you will need to click on the same scale checkbox between the variables you want stacked.
Fill in Stack first with the number of variables you would like stacked. Additional variables will be graphed normally. If this is left blank all variables will be stacked.
Dots, if checked, causes the graph to be displayed using a series of Dots instead of connected line segments.
Fill, if checked, will cause the area between stack graph lines to be filled in solidly instead of being left blank. This makes it clearer which elements of a stack graph are contributing. This option is only available for Stack graphs.
Width specifies the width in inches or centimeters (as set in the Options Settings dialog) the graph will appear when first displayed. You can, of course, always resize the graph.
Height specifies the height the graph will appear when first displayed.
Truncate x axis : This setting detects the first and last non-zero values being displayed. The x axis is then truncated to only show that range.