 The Stats tool provides summary statistics on the Workbench Variable and its causes or uses (depending on option settings). This tool provides a quick statistical overview of the values for a variable (that you could review in detail with the Table tool).
Stats Options
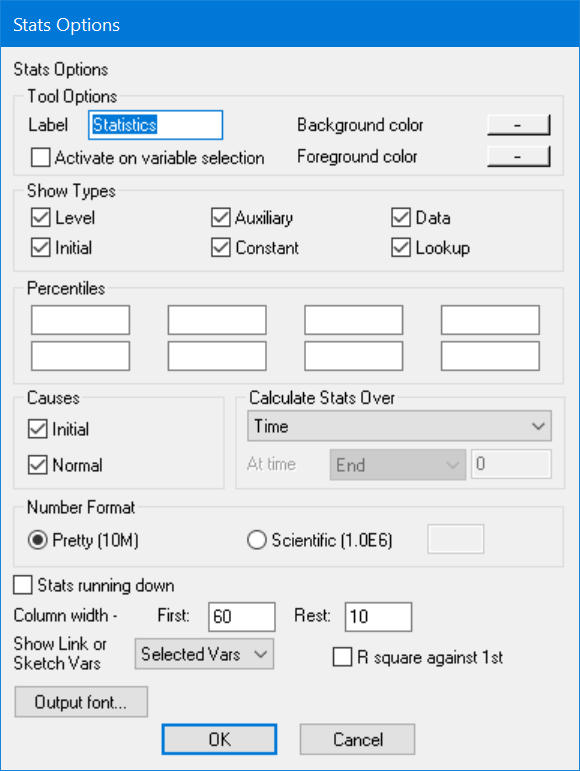
Most of the options for the Stats tool are the same as those for the Table tool except that Print Every is not used and Time Running Down is replaced by Stats Running Down. In addition there are some options specific to the Stats tool.
R square against 1st, if checked, will compare the values in each dataset against the first and report an R-square for this comparison. R-square is defined to be (1 - sum of square error / the variance of the variable in the first run). The resulting number ranges between -infinity and 1. The R-square of a run with itself is always one. To get the R-square of a simulation with data, load a dataset with the data as the first loaded dataset and the simulation as the second.
Percentiles allow you to get more detailed information about the distribution of the results. If you include 25 as a percentile, the Stats tool will report the number that is bigger than the value the variable took on 25% of the time. The 0th percentile is the minimum, the 50th percentile is the median and the 100th percentile is the maximum. You can enter any positive number to see the percentiles reported for this.
NOTEIf you change the options to add or remove either R-square or percentiles, you will need to delete the output of the Stats tool and invoke it again to see your changes.
Over, determines what to do the statistics over.
| • | Time, if checked, causes statistics for a given variable over the course of the simulation to be reported. This is the default. |
| • | Sensitivity, if checked, causes the Stats tool to work across sensitivity runs at a given time. You can set the time to look at as Start, Special, End or Select. If you choose Select you must also fill in a value. This option will only work on runs that are sensitivity simulations containing the variable to be displayed. Any other datasets will simply report missing. |
| • | Subs, if checked, will cause statistics to be reported across the subscripts for a given variable at the chosen time. The subscripts that will be reported are those selected in the Subscript Control. For example by selecting all elements of all subscripts in the Subscript Control you can use this to get the average value of a variable over all its subscripts at Special Time. |
Stats Output
Like the Table tool, an invocation of the Stats tool displays information in a read-only row-and-column format window, adding to the window if it is already open. Instead of displaying values, however, the Stats tool displays the following summary statistics for each variable.
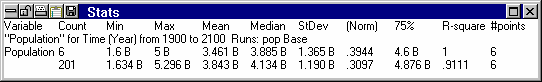
Count displays the number of points considered.
Min displays the smallest value among all the points considered. If the count is 1, this is the only information displayed.== F_36}(If the count is 1 then Min, Max, and Mean are the same, and the standard deviation is not defined.)
Max displays the largest value among all the points considered.
Mean displays the arithmetic average over all the points considered.
Median displays the number which the variable is bigger than one half the time and smaller than on half the time.
StDev displays the standard deviation over all the points considered. (Note that the standard deviation is computed using N, not N-1.)
(Norm) displays the normalized standard deviation (the standard deviation divided by the mean). This is computed only if the mean is non-zero.
75% displays the number which the variable is smaller than 75% of the time. You can choose to see up to 8 percentiles in this manner.
R-square displays the R-square against the first dataset.
#points shows how many points were compared in computing the R-square. This is shown only when R-square is shown. If two datasets have non commensurate time axes, this might be smaller than the number of points for either of the datasets.
The Stats tool uses Start time and End time to determine which points to review, unless you are viewing sensitivity results.