 The Table tool generates a read-only table that you can scroll to review values. The resulting table displays numerical values for variables and — depending on the Table Options settings — their causes or uses. The Table tool's most common use is for detailed analysis of a narrow time range, but it is also good for displaying a lot of values on the screen and also for displaying arrays of data at a given time.
The Table tool uses Start time, Special time, and End time from the Time Axis tab of the Control Panel to determine how to produce output.
Table Options
Right clicking or Control-clicking on the Table tool icon opens the Table Options dialog. You can specify how the tool should function and customize the appearance of the Table tool icon.
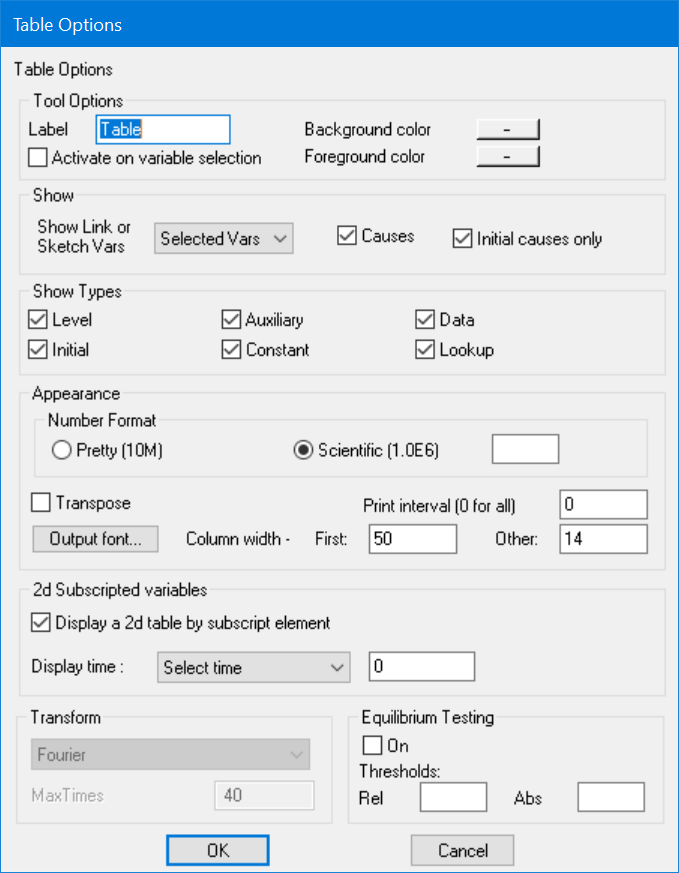
Show Link (Cause, Use, None) determines what variables the Table tool displays in addition to the Workbench Variable. See the Strip Graph Options section above for more detail.
Causes (Initial, Normal) determines which equations are traced when determining causes. See the Strip Graph Options section above for more detail.
Show Types (Level, Auxiliary, Data, Initial, Constant, Lookup) determines which types of variables are displayed by the Table tool. Level, Auxiliary, and Data variables display values at different times. Initial and Constant variables display only a single value that does not scroll with time. Lookup variables list the X-axis and Y-axis below one another.
Number Format (Pretty, Scientific) determines the format for displaying numbers.
| • | Pretty makes numbers easier to read. For example, numbers from 1,000,000 to 999,000,000 are displayed as 1M to 999M; numbers from 1,000,000,000 to 999,000,000,000 are displayed as 1B to 999B; numbers from 1E12 to 999E12 are displayed as 1Tr to 999Tr. |
| • | Scientific puts all numbers in the form 1.0E13, which generally shows more significant digits. |
Equilibrium Testing, if on, causes the Table tool to show all Levels that are changing between INITIAL TIME and the first Time saved after that. You can set tolerances to indicate how much of a change you want reported. If the change is bigger than Rel * the variable value at INITIAL TIME and bigger than Abs, it will be reported. If Rel and Abs are left blank, any change will be reported. Equilibrium testing is a useful way find out which levels are changing and pushing the model out of equilibrium. If you are doing Equilibrium testing, it is a good idea to set SAVEPER equal to TIME STEP.
Output Font lets you set the font that will be used in the table output. This option only has an effect when a new window is created for the table.
Print Every determines how often to table the numbers. Normally all the numbers are tabled and leaving Print Every at 0 will cause this to happen. If, however, you want to see the numbers less frequently you can set Print Every to a larger number. For example setting print every to 10 will show output at times 0, 10, 20 and so on. This option is only used when the Table tool creates a new window. Thereafter the times shown are set in that window.
Time Running Down, if checked, causes time to be displayed along the leftmost column of the table instead of across the top row.
Column Width determines the width assigned to different columns. The widths are measured in the number of zeros 0 in the selected font. This option is only effective when a new window is created.
| • | First sets the width of the first column. This column is not scrolled with the rest of the window, and normally contains variable names. |
| • | Rest sets the width of the remaining columns, which normally contain numbers. |
2d Subscripting† , if checked, causes Vensim to display values at a specific time with subscripts instead of time running across. Vensim will use the variable to be displayed along with the settings in the Subscript Control do determine which elements to display. It will display the last varying subscript across, and the second last varying subscript down. If more than two subscripts are varying this will be repeated. This is a very effective way of looking at all elements of a 2 dimensional array.
Transform determines if you see the model result over time or a transformation into another domain.
| • | Off is the normal setting and simply displays the value of variables over time. |
| • | Fourier, if checked, computes a Fourier transformation of the variables on the current time range and displays that with frequency and power information. Although times will still appear in the first row, they are not related to the output in this mode. |
| • | Autocorrelation, if checked, computes and displays the autocorrelations for the workbench variable from 0 lag time up to the number specified in Max Times. |
| • | Max Times determines how many SAVEPERs to compute the autocorrelation for. |
NOTE many of the options are used only when the Table output is first created. If you want all your options to take effect you might need to delete the Table tool's output window and invoke the Table tool again.
Table Output
The first time you click on the Table tool, a new window is created. Successive invocations add information to the bottom of this window without removing the old information. You can use the scroll bars to review earlier output. If you have multiple Table tools in the toolset, multiple output windows are created (one for each tool).
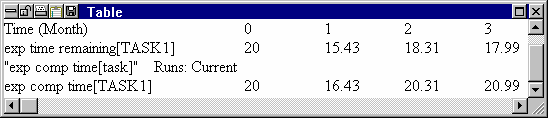
The Table tool creates a read-only display of numbers in row-and-column format (similar to a spreadsheet). The left-most column is a set of labels that do not move when the table is scrolled horizontally. You can scroll and resize the output window as you like. If only one value is found for a variable, the value for that variable is always displayed in the first column, regardless of the horizontal scroll position of the window. If no values are found, two dashes (--) appear in the first column. If some values are available and others are not, two dashes mark the missing values.
The Table tool reports whatever is in the dataset .vdf file without assuming whether or not it will find dynamic data. This works differently from the Strip Graph tool, which first determine the type of a variable from the model and then look for its values. For example, if you have two datasets loaded representing runs from two separate models, and RESOURCES REMAINING is a Constant in the current model and a Level in the old model, the Strip Graph tool will report the first dataset as having no values. But the Table tool will report the complete set of values from the first dataset.