To create a simulation model, it is necessary to add a little bit more structure. You may, if you prefer, also change to a stock and flow notation. Using stock and flow notation is not strictly necessary, and we will not do that here. We will, however, mark the Level variable (in fact there is only one) with boxes.
Build the following diagram, or open the model UserGuide\chap20\complete\repair02.mdl.
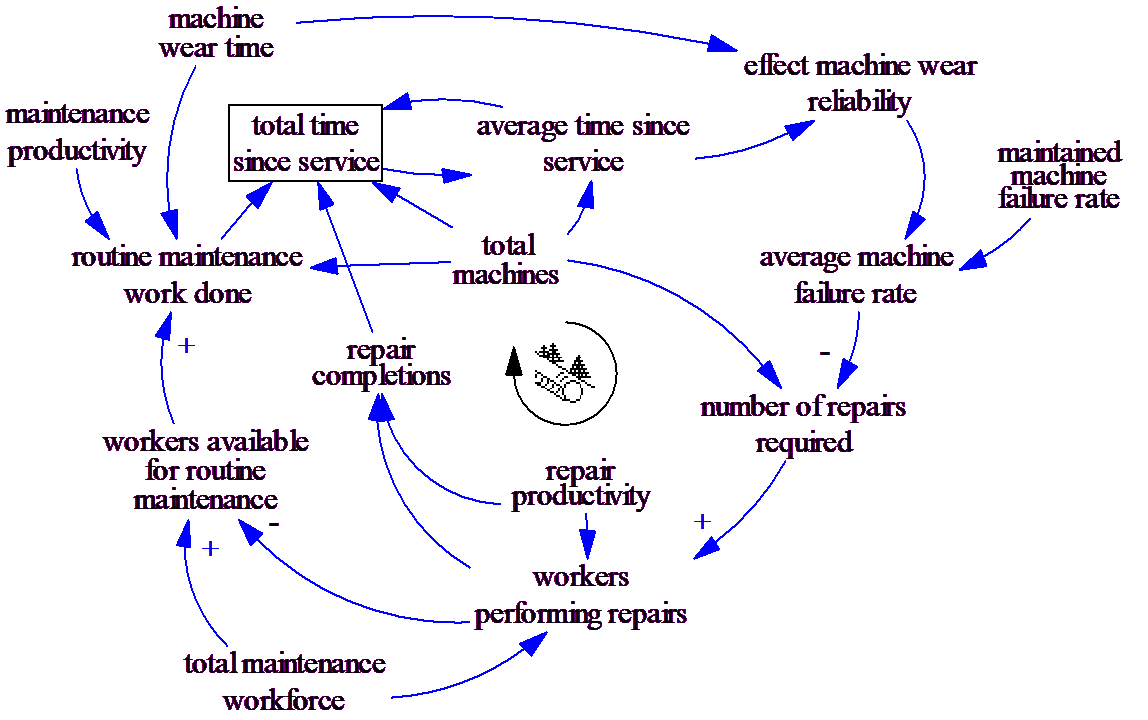
This model has a somewhat complicated construct that is a variation of the coflow. We measure the average time since machines have been maintained by using the variable total time since service. This is the total number of machine hours elapsed since service for all the different machines. With each unit of time this increases by total machines, but it is decreased when a machine is repaired or routinely serviced. The amount that it decreases depends on how long the repaired or serviced machine had gone without service. Our simplifying assumption for this is that this is just the average machine age. A more complete treatment could differentiate the repair and maintenance age distributions, but would make the model quite a bit more complicated.
The equation for total time since service is thus:
| total time since service= INTEG (total machines – |
| (repair completions + routine maintenance work done) * |
| average time since service, |
| total machines * machine wear time) |
The initialization in this is used to put the model near an equilibrium at the beginning of the simulation. To get the average age of machines we just divide total time since service by the total machines (the number of machines). This average time is then used to drive reliability.
You will notice in this model that we changed from average machine reliability to average machine failure rate. The main reason for this is that is seems to be easier to formulate the equation for it. Reliability is basically 1-unreliability so it could have been done as in the original causal loop diagram but probably would not have been harder to undrestand.
The full equations for this model are:
| average machine failure rate= |
| maintained machine failure rate * |
| effect machine wear reliability |
Units: 1/Month
| average time since service= |
| total time since service/total machines |
Units: Month
| effect machine wear reliability= WITH LOOKUP ( |
| average time since service/machine wear time, |
| ((0,0.9),(1,1),(1.5,1.1),(2,1.5),(3,3),(4,6) )) |
Units: Dmnl
machine wear time=2
Units: Month
maintained machine failure rate=0.1
Units: 1/Month
maintenance productivity=120
Units: Machine/Person/Month
| number of repairs required= |
| average machine failure rate * total machines |
Units: Machine/Month
| repair completions= |
| workers performing repairs * repair productivity |
Units: Machine/Month
repair productivity=30
Units: Machine/Person/Month
| routine maintenance work done= |
| MIN(total machines/machine wear time, |
| workers available for routine maintenance * |
| maintenance productivity) |
Units: Machine/Month
total machines=1000
Units: Machine
total maintenance workforce
Units: Person
| total time since service= INTEG (total machines – |
| (repair completions + routine maintenance work done) * |
| average time since service, |
| total machines * machine wear time) |
Units: Machine*Month
| workers available for routine maintenance= |
| total maintenance workforce – |
| workers performing repairs |
Units: Person
| workers performing repairs= |
| MIN( |
| number of repairs required/repair productivity, |
| total maintenance workforce) |
Units: Person
Note that the equation for total maintenance workforce is blank. Blank equations are used to indicate data variables. If you followed the instructions earlier in this chapter you would not have needed to add that equation directly as it would have been put in place by Vensim. The units, however, will still need to be added.
If you simulate this model and then display behavior (the B key will toggle the display of behavior on and off) you should see:
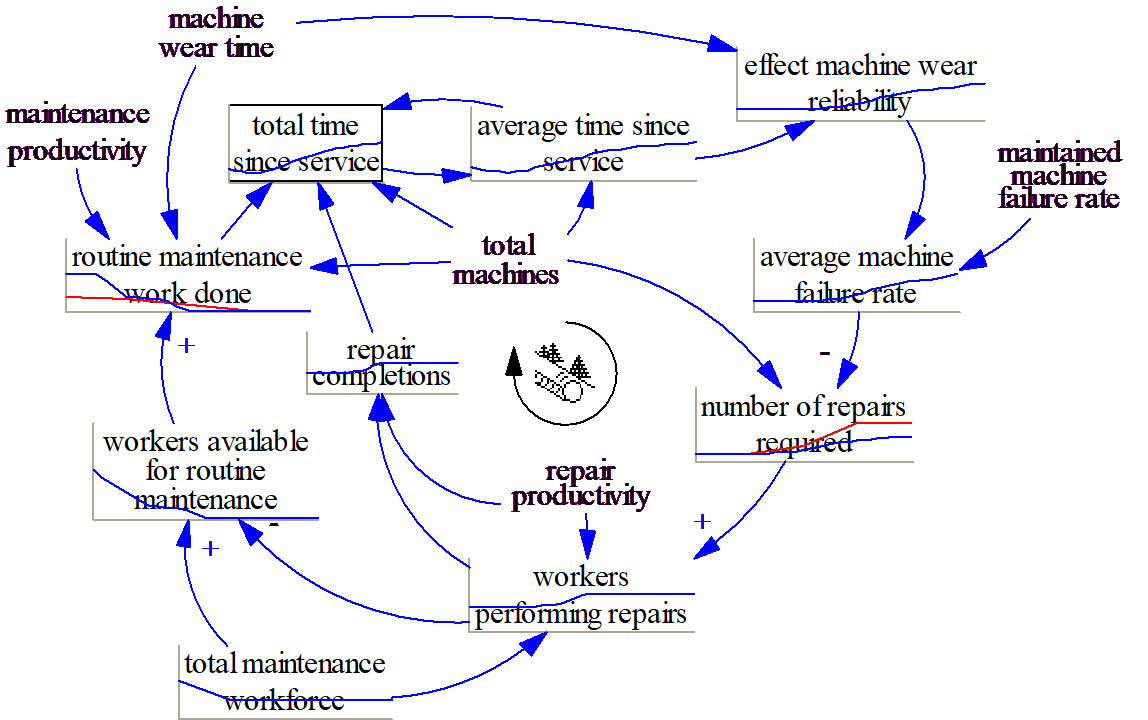
We are partially replicating the two reference modes that were entered. While the behavior is not exactly the same, it is similar. Given scaling and other issues with reference modes it is common for there to be some differences with simulated behavior
We have developed a model from conceptualization through simulation using reference modes to help in the process. The reference modes add a concrete representation of behavior early in the model development process and also make it easy to profile exogenous inputs.