All Vensim models, whether simulation models or not, have Time Bounds. These are the INITIAL and FINAL TIMEs over which the simulation will occur, the TIME STEP for integrating and the SAVEPER for saving results.
NOTE If you are using the Text Editor the Time Bounds tab will not be available and you will need to go to the equations for the control parameters and modify them directly (or use View>As Sketch, change them, then use View>As Text to change back to text mode).
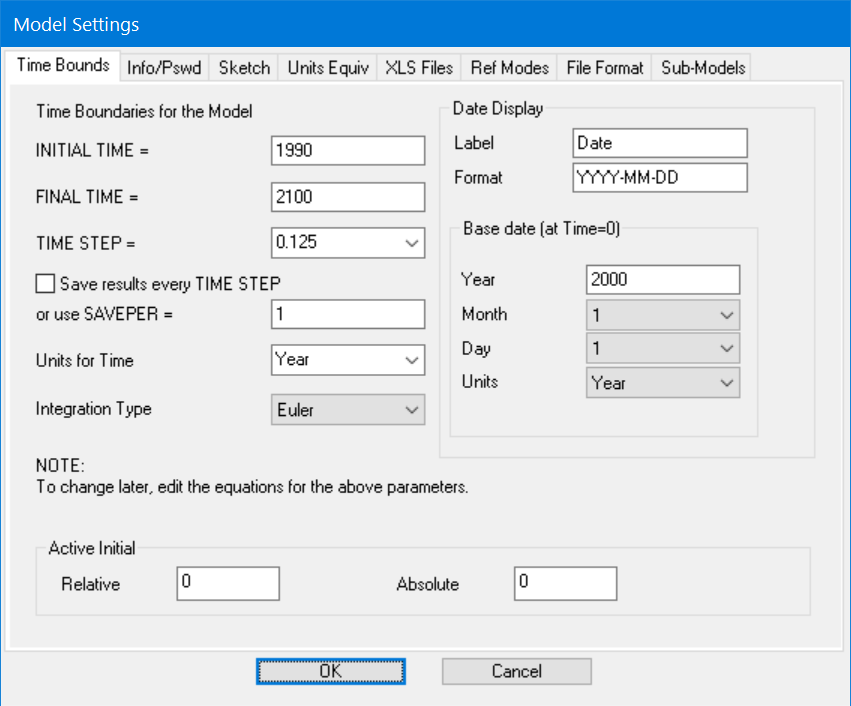
INITIAL TIME is the time at which the simulation will begin.
FINAL TIME is the time at which the simulation will end.
TIME STEP is the time interval for the simulation. You can type in a value or select one from a list by clicking on the drop-down button at the right. The best choice for time step is normally a power of 1/2, to prevent rounding errors from distorting the Time axis. You should choose a TIME STEP small enough to prevent serious integration error. See the discussion of TIME STEP under "Selecting an Integration Technique" later in this chapter.
Save results every TIME STEP, if checked, sets SAVEPER to be equal to TIME STEP. This is the default and normally quite acceptable.
SAVEPER is frequency with which simulation results are saved. If you take away the check above this you can fill in a value. If the formula (FINAL TIME-INITIAL TIME)/TIMESTEP gives a value bigger than 1000 you will probably want to use a different SAVEPER than TIME STEP. Making SAVEPER bigger decreases the size of simulation files and increased the speed of simulations.
Units for Time, lets you specify the units of measure for time. These are used in checking the units of Levels which are accumulations of their inflows and outflows. All of the number in the other fields are measured with this unit. You can click on the drop-down arrow to the right to get a list of commonly used units or type in any units you like.
NOTE All of the control parameters that you set from this dialog can also be set directly by writing equations for the control parameters. By default all except SAVEPER are constants, but they do not need to be constants. The example model ball.mdl demonstrates the writing of an equation for TIME STEP that depends on conditions detected in the model. If you do make changes to control parameters in this model, you will get a message that there were problems updating and that you should use the Equation Editor. Some of the changes you make might still hold.
Integration Type, lets you specify the type of integration to be used with the model. The defaults is Euler, and you can also choose Runge-Kutta integration. You can change the integration technique during simulation setup.
Date Display (not on PLE or PLE Plus)
Date displays provide a convenient mechanism for labeling graphs and tables with dates instead of simply numbers. To use this specify the date corresponding to the 0 value of Time, and provide a format for displaying the date string. For example, if the model runs from 0 to 60 months and you want that to correspond to 2000 to 2005 you would enter the Date Display value shown above and get:

instead of
This is the same graph, but with different labeling.
Label is the label that will appear along the horizontal axis of the graphs.
Format specified how to format the time string and consists of following components which can appear in any order
Y the year use YY for 2 digits or YYYY for 4 digits.
Q the quarter (1-4)
M the month (1-12) use MM for (01-12)
N the name of the month (Jan-Dec)
D the day (1-31) use DD for (01-31)
W the weekday (0-7 0 is Sunday)
X the named weekday (Sun-Sat)
H the hour of the day (0-24) use HH for (00-24) If units are hour, minute or second this keeps growing.
I the minute of the hour (0-60) use II for (00-60)
S the second of the minute (0-60) use SS for (00-60)
\x repeat the letter exactly (eq YYYY\QQ would give 2000Q1 and so on)
:-…. Anything except the letters A-Z (or a-z) is just repeated in the output string
If you are working with a model in Year, Quarters or Months a year is treated as being made up of 12 30 day months with no leap year consideration. So that ½ way through month will always be the 15th and the last day of the month is always the 30th (truncated to 28 for February). For models in Weeks or Days the actual calendar, including leap years, is used. For models in hours, minutes or seconds the base date is ignored and the time in the model is broken into hours, minutes and seconds starting from 0.
Year is the base year corresponding to time 0. For example if your model runs from 0 to 20 years and you want the display from 2005 to 2025 you would set this to 2005. If you have set the initial time in your model to 2005 you would leave this at 0.
Month is the initial month corresponding to time 0.
Day is the initial day corresponding to Time 0.
Units is the units of measure for the date display. Normally these are the same as the units of measure for Time in the model. You can use different units here if you want to compute data values against an alternative Time Base. If you do this you will need to be sure that the appropriate time base is chosen for display in the Time Axis tab of the control panel.