Lookups are treated just like other variables in Vensim in that they can have subscripts, units equations, and comments. You can type in the equation for a Lookup in text format, as in:
((0,0),(.2,.1),(0.8,1),(1,1))
A graphical entry can be a desirable alternative because you can visualize the shape and nature of the function. To create or manipulate Lookups in graph form, you use the Graph Lookup Editor.
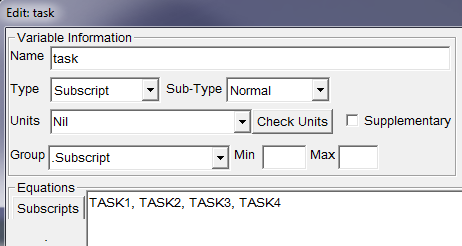
The Graph Lookup Editor can be used from the Equation Editor, during simulation setup, while running a Venapp and from the Text Editor. From from the Equation Editor, the Graph Lookup Editor is opened by clicking on the As Graph button. This button is only visible if the variable type is Lookup or Auxiliary with Lookup. If you want to change a variable to a Lookup, use the variable type combo box to select Lookup or Auxiliary and subtype "with Lookup."
The Graph Lookup Editor is a graphical way of entering the x,y pairs for the Lookup. When you open the Graph Lookup Editor on a new Lookup, the graph will be empty with scales running from 0 to 10.
You can type commentary into the editing window just below the graph title (e.g., "Graph showing..." above). This commentary comes from, and goes into, the comment field in the Equation Editor. If you open the Graph Lookup Editor from somewhere other than the Equation Editor this text will be displayed, but will not be editable.
Export exports the lookup to the clipboard. The graph as it currently appears is exported as a Windows Metafile (or in PICT format on the Macintosh). The values are exported as two tab delimited lines of text. If you want to paste the graph into another application you might need to use Paste Special in the application.
Print prints the graph as it currently appear. You will get the same print options as you would with other Vensim graphs.
Input/Output provides a mechanism for typing in x,y pairs. Simply type in the numbers you want. Pressing the Tab or Enter key or clicking outside the cell will make your entry official, and the corresponding point will be changed. You can also add new numbers at the bottom of the list or just below where it says New (the New pair is always empty). You can edit an entry but not delete it. To remove or delete a point, you need to use the Clear Points button and click on the graph (see below).
The Input/Output pairs are always stored in ascending x order. Because of this, entering a new x-value can cause things to jump around. If you try to enter a bad number, you will be notified.
The scroll bar to the right of the Input/Output pairs can be used to review all points when there are more then 11 pairs. There is no limit to the number of pairs in a Lookup.
New is the same as the Input/Output pairs except that it allows you to add new points to the graph. Just type in an x,y pair. The pair will go into the list above and the New entries boxes will be cleared.
Import Vals allows you to take data that is in the Clipboard and bring it into the Lookup Editor. This data will replace whatever values currently exist. Vensim will look for Tab or Comma delimited data in the Clipboard. If it finds two lines of data it will treat the first as X values and the second as Y values. If it only finds one line, it will treat this as Y values and query you for an appropriate starting value and increment for the X axis. If the first entry in the data is a name, it will be ignored.
The graph itself can be used to modify the Lookup. See "Moving Points" and "Tracing Lines" below.
The input is... appearing in the bottom window (under the X-axis) is an additional part of the comment that describes the X axis. In the Equation Editor, it is separated from the comment at the top by the special character sequence \!. You can type in what you want here. Just as with the comment at the top, it will appear as uneditable text when the Graph Lookup Editor is used from someplace other than the Equation Editor.
X-min and X-max allow you to control the horizontal scaling. This is useful if you want to focus on a few points or add new points well outside of the old scales. Since lookups can have any interval between x-axis points, it is often desirable to leave off one or both of the end points and concentrate on the middle points. You can click on the down arrow at the right of the values or type in a value and the graph will rescale. The values you set for X-min and X-max will be recorded for your next use of the Lookup Editor, but they do not affect simulation output.
You can also change X-min and X-max by holding down the Shift key and dragging the pointer over the range you want to zoom in on.
x= , y= shows the x and y values associated with the current pointer location when the pointer is on the graph. This tells you what values will be associated with a point you place at the current location.
Y-min and Y-max allow you to control the vertical scaling. This is useful if you want to focus in on a few points, or if you want to add points well away from the current scale settings.
You can type in any value you want for Y-min and Y-max. As you type the graph will automatically adjust to the scale you are entering. Clicking on the down arrow to the right of the value allows you to select from commonly useful values. The values you set for Y-min and Y-max will be recorded for your next use of the Lookup Editor, but they do not affect simulation output.
You can also change Y-min and Y-max by holding down the Control key and dragging the pointer over the region you want to zoom in on.
The values of existing points will not change when you change Y-min and Y-max.
Reset Scaling resets all of the scaling points (X-min, X-max, Y-min, Y-max) so that the Lookup fits comfortably into the graph. You can set the separate scaling points individually to focus on certain values.
Whenever you move a point outside of the visible graph, the graph will automatically be rescaled to include that point. If, however, you have previously set any of the scaling points, not all the points in the Lookup will necessarily be visible. The Reset Scaling button makes all points visible.
The output...appearing in the right hand window (under Y-max) is an additional part of the comment that describes the Y axis. In the Equation Editor it is separated from the comment at the bottom by the special character sequence \!. You can type in what you want here. Just as with the other comment it will appear as uneditable text when the Graph Lookup Editor is used from someplace other than the Equation Editor.
Clear Points/Add Points toggles between point deletion and point insertion modes. You can add new points to a Lookup by clicking anywhere. To delete points, first click on the Clear Points button (which will become an Add Points button), and then click on the points you want to delete. If you are adding points, the standard pointer will be present. If you are clearing points, the delete pointer (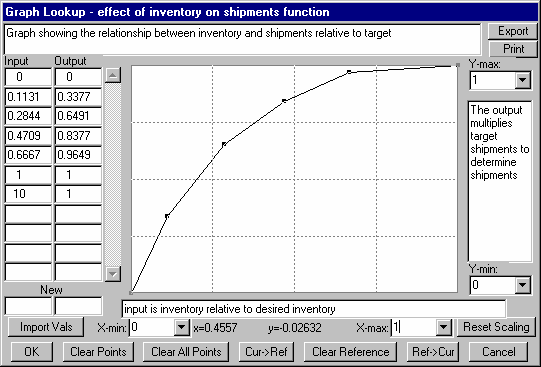 ) will appear.
Clear All Points clears all the points in the Lookup. This is useful if you want to start over.
Cur->Ref makes the current set of points the Reference Points. Reference Points appear in light gray and can be useful as a baseline for drawing a graph. For example you might want to enter a straight line from 0 to 1 to highlight the difference in the curve you are drawing from this straight line. You can also use this to change record the previous graph for reference as you make adjustments. Note that when you click on Cur->Ref you will not see the reference line since it will be beneath the current line.
Clear Ref causes the reference line, if any to be removed.
Ref->Cur causes the reference line to replace the current graph line. If there is no reference line nothing will happen.
NOTEThe Enter and Esc will not close this dialog. If you are deleting points the Esc key will put the Lookup editor back in add-point mode. Otherwise there is no effect.
Moving Points
You can drag existing points up and down and back and forth by pressing the left mouse button down while over a point and dragging the point. You cannot drag a point before the previous point on the X-axis or after the next point on the X-axis.
Tracing Lines
You can trace a line by dragging the mouse across the screen. To do this press the left mouse button away from all existing points and move the mouse. The x-axis positions of all the points will remain fixed, but the points will jump up and down the y-axis to meet the pointer.