The curves used to represent prioritizations need to be nonnegative, continuous (no jumps) and monotone. More specifically, demand/prioritization curves need to slope down and supply curves need to slope up. In addition, there are two restrictions on shape that, though they are not strictly necessary for this approach to allocation to work, do make sense.
| • | There should some priority beyond which the quantity will no longer increase. This might be due to hard constraints on capacity (for production) or satiation for demand. |
| • | There should be some priority for which the quantity gets very small or actually becomes 0. |
Generally this leads to curves that are roughly S shaped and characterized by their midpoint, and the distance over which they are spread. The set of shapes Vensim makes available are shown in the following graph:
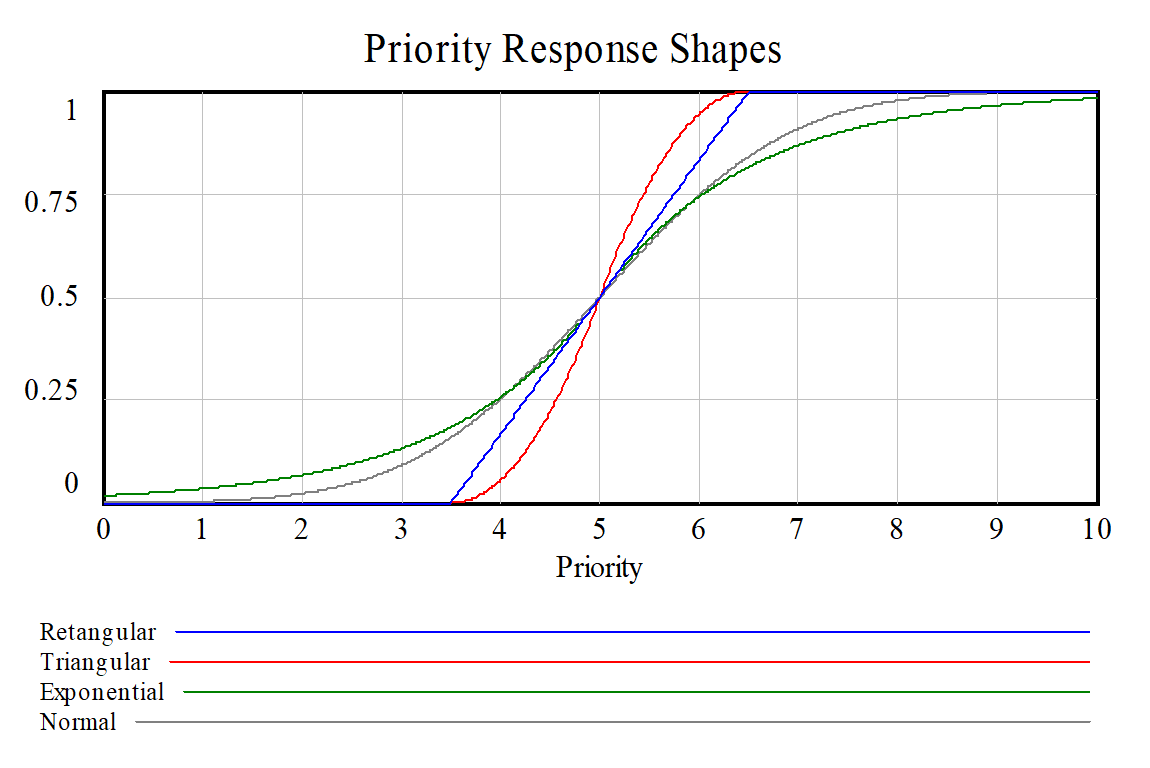
Each of these shapes is the integral of the named shape. The integral of the exponential is actually the symmetric integral from 0 out. The rectangular and triangular distributions have a width of 3. The shape parameter on the Normal curve is the standard deviation and is set to 1.5 in the above graph. The shape parameter for the exponential just stretches exp(-priority) and is also set at 1.5.
These shapes provide a pretty good selection of smoothness and contained change. For most purposes the normal curve has very good behavior. The tails force continuity and always keep all actors active, just with tiny numbers. This is helpful if you are looking at sensitivities because changes in the priority of any supplier or demander will not cause a movement from 0 to a significant positive number as can happen with the rectangular case.
In addition to these shapes Vensim includes a truncated constant elasticity curve. The equation for constant elasticity is
quantity = A * price ^ ε
Where the elasticity ε is positive for supply curves and negative for demand curves. For demand curves as price goes toward 0, the quantity becomes infinite and this is why the constant elasticity demand curves are truncated (satiation) at a minimum price and the supply curves are truncated (capacity) at a maximum price. In most cases these truncations will not matter as the price will be within the normal range of behavior.