There is very little real hierarchy in the Bar Graph. However, it is convenient to think of variable and dataset selection as different levels in the hierarchy. Except for the initial keyword (:BAR-GRAPH), any :AS-RUN keys and :BAR-VAR-TIME, the order of keywords is unimportant.
NOTE A complete Custom Bar Graph definition requires one :BAR-GRAPH and one :VAR line.
Graph Labeling and Control
:BAR-GRAPH name begins the description of a bar graph. The name appears in the Graphs tab of the Control Panel as an identifier for the graph.
:BAR-BY-TIME - display the first variable as a bar graph over time. Additional variables will be ignored.
:BAR-TIME value specifies the time at which the bar values are to be taken. This time is interpreted in the context of the currently selected Time Base. If :BAR-TIME is not specified, Special time is used.
:FORCE - prevents the display of a Bar Graph as a modified Graph when the number of bars grows large. This is useful if you are trying to display a lot of things on a Bar Graph.
:HEIGHT value specifies the width of the bar graph (including labels). The value for width is in inches or centimeters depending on what you have set in the Global Options dialog.
:HORIZONTAL makes the bars horizontal (the default is vertical).
:NO-LEGEND n suppresses the legend at the bottom of the graph, the title of the graph and labels. Use 1 to suppress the legend, 2 to suppress the title and 4 to suppress the division labels. Adding these up will suppress more than one thing (for example 3 suppresses the legend and title).
:OSUBTITLE text - defines a text string that will be displayed above the Bar Graph rectangle on the left. This keyword is ignored unless the :HORIZONTAL keyword has been used and at least one :OVAR keyword have been used specified.
:SOFT-BOUNDS - allows the Bar Graph to reset the scaling if the bounds are exceeded. This is typically most useful in conjunction with the :WIP keyword.
:SUBTITLE text - defines a text string that will be displayed above the Bar Graph rectangle. This keyword will be ignored unless the :HORIZONTAL keyword is also used.
:TITLE text defines the title of the bar graph. If not specified, the name of the bar graph will be used as its title.
:WIDTH value specifies the width of the bar graph (including labels). The value for width is in inches or centimeters depending on what you have set in the Global Options dialog.
:WIP - forces the bar graph to display itself during the simulation. This can be an effective animation technique for larger models but the Bar Graph may change to quickly to prove interesting in smaller models.
:X-LABEL text specifies the x-axis label.
:Y-MAX value defines the maximum value on the y-axis.
:Y-MIN value defines the minimum value on the y-axis.
Variables on the Bar Graph
:VAR var1|label1,var2|label2, ... supplies a list of variables to be included. It makes no difference whether you place multiple variables on a single line or one variable per line. The labels are optional.
:OVAR var1|label1,var2|label2, ... supplies a list of variables to be included for display on the left which is opposite to the display of a :VAR. This allows you to make two sided bar graphs which are especially useful for comparing two things that differ along one dimension. The most common use for this would be to create population pyramids as shown in the example. This keyword will be ignored unless the :HORIZONTAL keyword is also used.
:BAR-VAR-TIME - display the variable at a time. This allows you to display different variables at different times (or the same variable at different times). This applies only to the :VAR that directly precedes it.
Datasets on the Bar Graph
:DATASET filename|label specifies the name of the dataset in which values for the variable will be found. The label is optional. You can used wildcards in specifying datasets as described in the "The Structure of .vgd Files" above. If no dataset is named, all of the loaded datasets will be used.
:RUN name|label is a synonym for dataset.
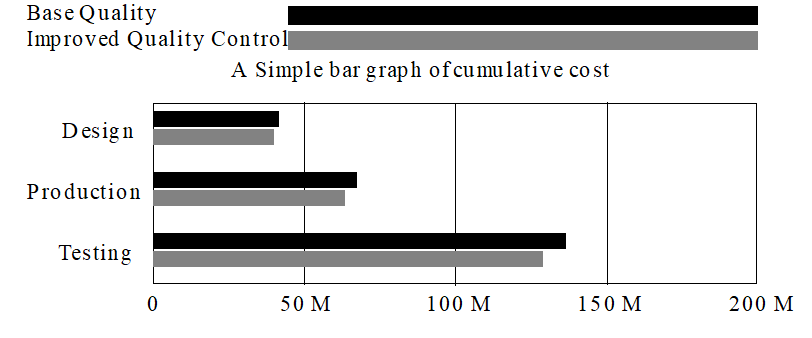
Example
:bar-graph Cost_bar
:title A Simple bar graph of cumulative cost
:horizontal
:var cum cost[design]|Design
:var cum cost[produce]|Production
:var cum cost[test]|Testing
:run basequal.vdf|Base Quality
:run highqual.vdf|Improved Quality Control

Grouping Variables as Runs
Normally, Bar Graphs display each variable in a group with the same variable from different runs as shown above. In some cases, however, it is desirable to group different variables together by a subscript or another attribute.
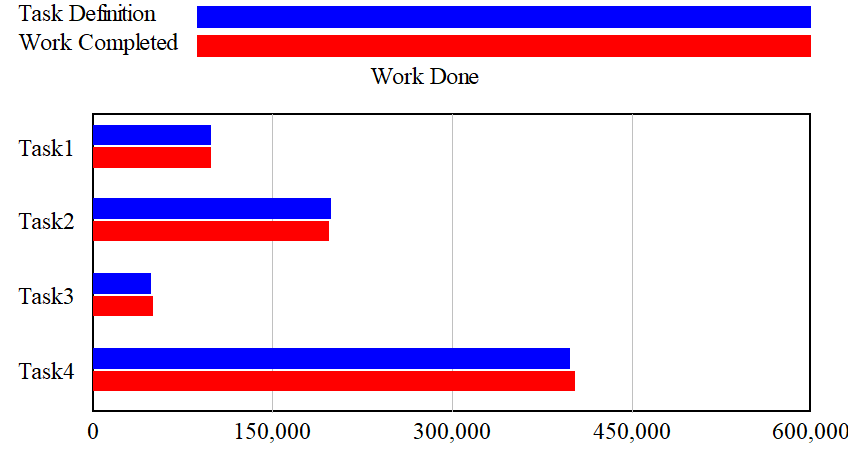
:AS-RUN label indicates that the variables that follow are to be treated as if they were from a single run – with label representing the name of that run. For example
:BAR-GRAPH WORK_DONE
:TITLE Work Done
:HORIZONTAL
:AS-RUN Task Definition
:VAR TASK DEFINITION[TASK1]|Task1
:VAR TASK DEFINITION[TASK2]|Task2
:VAR TASK DEFINITION[TASK3]|Task3
:VAR TASK DEFINITION[TASK4]|Task4
:AS-RUN Work Completed
:VAR Work Completed Correctly[TASK1]
:VAR Work Completed Correctly[TASK2]
:VAR Work Completed Correctly[TASK3]
:VAR Work Completed Correctly[TASK4]
:DATASET Base
would result in

Note that you can combine multiple datasets with :AS-RUN though it is not recommended. In this case the datasets will be grouped most closely together.
If you use :AS-RUN make sure that the same number of variables appear under each :AS-RUN group and that the orders are consistent. Only the first set of variable labels will be used.