| Ø | Select Model>Import Dataset…. Choose the file orders.dat and click Open. |
| Ø | Click OK to the conversion message and close the Output window. |
| Ø | Double click the Runname editing box and type a name for the dataset, e.g., base. |
| Ø | Click on the Set Up a Simulation button. |
| Ø | Click on the dataset editing box right of the integration button that reads Euler and type in orders. |
| Ø | Click on the Simulate button. |
| Ø | Click on the Control Panel button and then on the Datasets tab. Unload the dataset orders by double clicking on it. |
| Ø | Double click on the Level Store Inventory then click on the Graph tool. |
| Ø | Double click on the variable Cumulative Profit then click on the Graph tool. |
| Ø | Click the Output Windows button and drag the top graph off the bottom graph. |
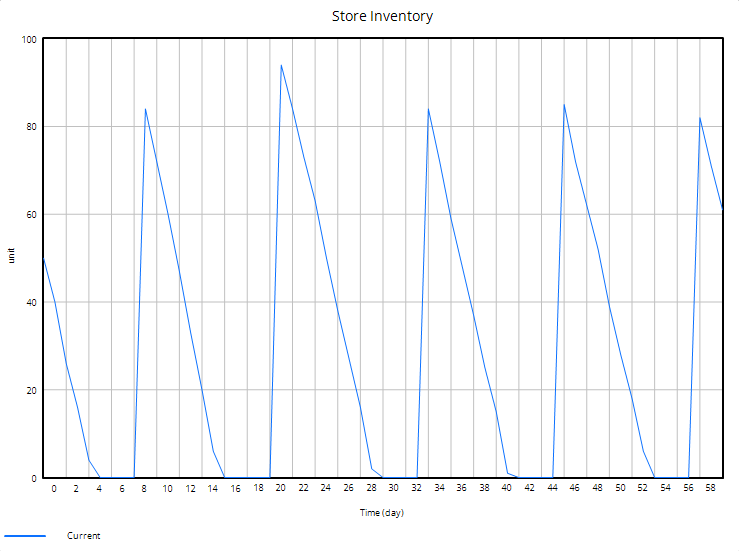
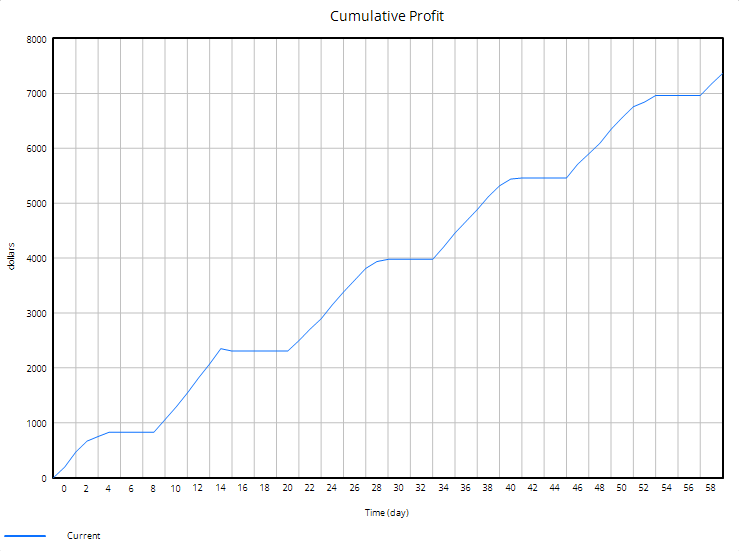
This is our base case, ordering when inventory falls to 20 units (min inventory value) and building up to a maximum of 100 units (max inventory value). Note, however, that Inventory falls to zero for some time before being restocked.
Optional — Manual Optimizing
As an exercise, you can try to manually optimize the model.
| Ø | Click the Set Up a Simulation button. Type a name for the dataset, e.g., manual. |
| Ø | Click on the Constants min inventory value and max inventory value and change their values. |
| Ø | Click the Simulate button. |
| Ø | Select the variable Cumulative Profit into the workbench and click on the Graph tool. |
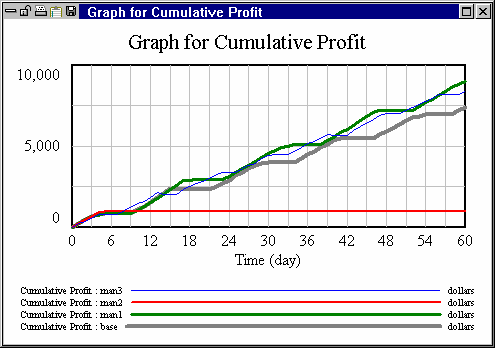
Compare the final value of Cumulative Profit in this run to the base run. If you want, continue by trial and error to try and maximize Cumulative Profit. You will get a series of runs similar to below: