Causal Tracing is a powerful tool for moving through a model tracing what causes something to change. Causal Tracing Analysis tools can be configured to show the causes of a variable or the uses of a variable (the opposite direction to causes).
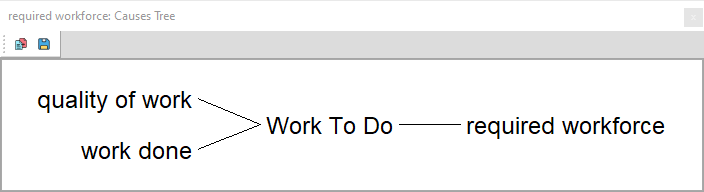
Causes Tree Diagram
| Ø | Click on the Causes Tree tool |
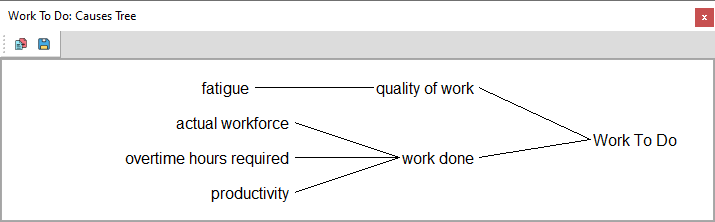
We can trace through the diagram looking at what causes any particular variable.
| Ø | Click on fatigue appearing in the tree diagram window then click on the Causes Tree tool again: |

We can see that fatigue is caused by overtime hours required and by Work To Do. Now we have traced all the way around one feedback loop, starting and finishing at Work To Do. Let us look at what causes actual workforce.
| Ø | Click on actual workforce appearing in the first tree diagram or on the sketch then click on the Causes Tree tool: |
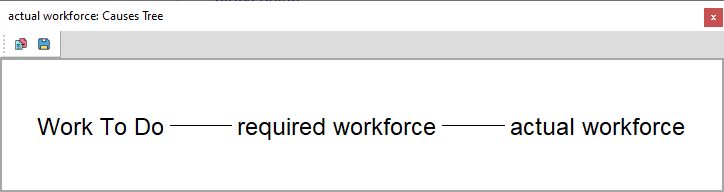
We have traced another causal loop, from Work To Do through actual workforce and back to Work To Do.
| Ø | Click on productivity either in one of the previous tree diagrams or on the model sketch and then click on the Causes Tree tool: |

There are no causes of productivity; it is a Constant or Exogenous in this model.
Analysis Tool Options (Not PLE or PLE Plus)
The analysis toolset for Vensim PLE and PLE Plus is fixed. In the other Vensim configurations the Analysis tools have options which cause them to display different information about the model. To look deeper into the model, you can set the tree diagram to different depths.
| Ø | Click using the right mouse button (or Ctrl + Click) on the Causes Tree tool. Several options will appear. Select Tool Options. Alternatively, you can hold Ctrl and right-click on the Causes Tree tool to open this without confirmation. The Tree Diagram Options dialog opens: |
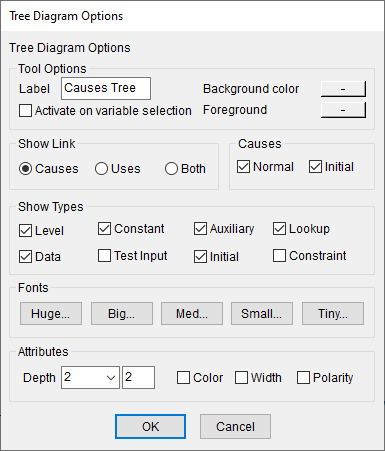
| Ø | Click on the drop-down arrow in the Depth box and select 6, then click on OK. |
| Ø | Click on the variable Work To Do. Click on the Causes Tree tool . You should see the causes of Work To Do to a depth of up to 6 causes: |
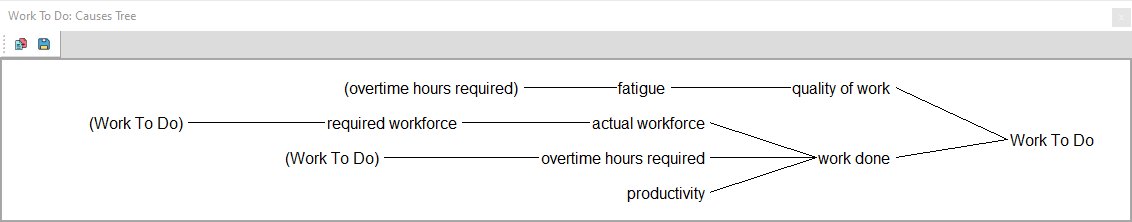
Note that both Work To Do and overtime hours required are enclosed in parentheses and terminate the diagram before a depth of six causes are reached. The parentheses indicate that this variable appears somewhere else on the diagram, and therefore that there is a feedback loop within this tree diagram.
Automatic Tool Activation (Not PLE or PLE Plus)
When tracing a lot of structure, it can be useful to have the Analysis tool automatically activate whenever you select a new variable as the Workbench Variable.
| Ø | Click using the right mouse button (or Ctrl + Click) on the Causes Tree tool. |
The Tree Diagram Options dialog opens (see above).
| Ø | Click on the drop-down arrow in the Depth box and select 2. |
| Ø | Click on the checkbox for Activate on variable selection, then click on OK. |
| Ø | Click on the variable required workforce, appearing in the tree diagram. |
A Causes Tree is automatically generated.
| Ø | Click using the right mouse button (or Ctrl + Click) on the Causes Tree tool. |
| Ø | Click on the checkbox to uncheck Activate on variable selection, then click on OK. |
Uses Tree Diagram
Now let us look at a Uses Tree diagram.
| Ø | Click on Work To Do to select it as the Workbench Variable (check the title bar). |
| Ø | Click on the Uses Tree tool. |
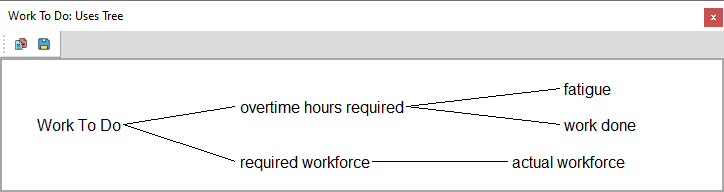
Uses are the opposite of causes, you see where in the model Work To Do is used.
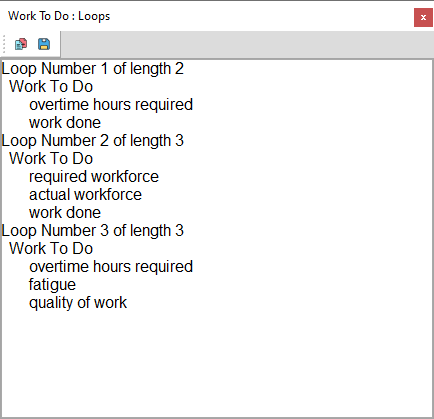
Loops Tool
Now let us look at a tool that finds feedback loops for you: the Loops tool.
| Ø | Make sure Work To Do is still the Workbench Variable (look at the title bar). |
| Ø | Click on the Loops  tool. Work To Do is involved in three feedback loops: tool. Work To Do is involved in three feedback loops: |
Document Tool
This tool provides a text-based description of some aspect of your model. In Vensim PLE and PLE Plus the document tool will display information about all model variables. In the other configuration you can set the options to display different things about the model, but the default is to document only the Workbench variable.
PLE and PLE PLUS
| Ø | Click on the Document tool. tool. |
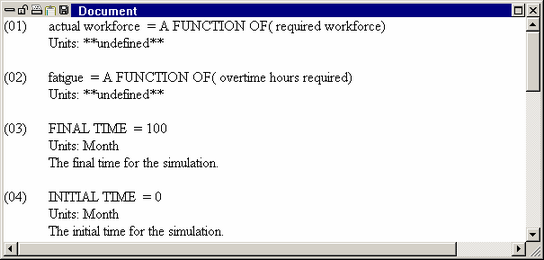
The different model variables are numbered and displayed in alphabetical order. You will notice that the variables FINAL TIME, INITIAL TIME, SAVEPER and TIMESTEP also appear in the document output even though you did not add these to the model. These four variables are used to control simulations and are part of every model - even models that have only diagrams.
Other Configurations
First, we will examine the Workbench Variable:
| Ø | Make sure Work To Do is still the Workbench Variable (look at the title bar). |
| Ø | Click on the Document tool. |
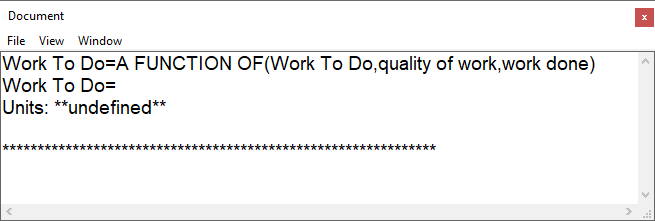
The output displays a text description of the equations and definition of the variable Work To Do. Next, let us document the entire model by changing the options for the Document tool:
| Ø | Use the right mouse button and select Tool Options (or Ctrl + Right Click) on the Document tool. |
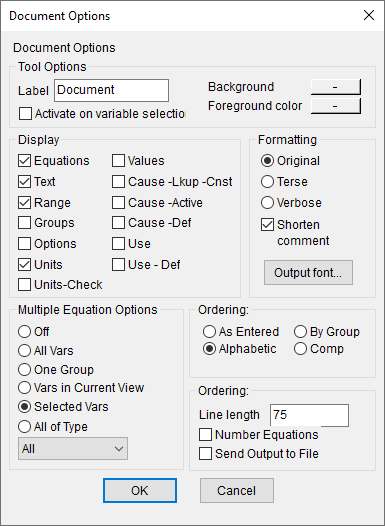
| Ø | In the Display field, uncheck the check boxes Range and Units. In the Multiple Equation Options field, click the option button All Vars. Click on OK. |
| Ø | Click on the Document tool. |
A description of your entire model is generated. If you kept the document Output window (from the exercise above) open, the output is added to this window. If you closed it, a new window is generated containing the information. Note that the time bounds for the model are included, even though this is not a simulation model.
Saving Analysis Toolsets Not PLE or PLE Plus
NOTE When you close Vensim, you will see a message asking you "Do you want to save the current toolset" Yes/No/Cancel.
| Ø | Click No if you want to keep the original default toolset (default.vts). |
| Ø | If you want to save the toolset with the settings you have made, you should click Cancel, then select menu item Tools>Analysis Toolset>Save As, and type in a new toolset name, then click Save. |