Every molecule is a complete simulation model. Each molecule consists of variables and causal structure (graphically displayed), and equations underlying each variable. When a molecule is open, you can select, with the pointer, how much of the molecule to copy. Using the menu item Edit>Copy, the highlighted portion of a molecule is copied, complete with structure and equations. Anything not highlighted is left behind. You can select the entire molecule (including any text) with Edit>Select all (Ctrl + A).
Adding a Molecule
•Start Vensim.
•Select File>New Model.
•Click the OK button to accept the default time bounds.
•Select Windows>Molecules.
•Both your new model and the molecule control are open. You can switch between them by holding down the Ctrl key and pressing the Tab key, or choosing the model or molecules window from the Windows menu.
•Double click on the molecule Level.
The Level molecule is displayed. (You can move between the three open windows with Ctrl + Tab.)
•With the Pointer, drag a box to highlight the entire level and rate formulation of the Level molecule. or Select all (Ctrl + A).
•Select Edit>Copy (or Ctrl + C).
•Press Ctrl + Tab twice to bring up the new model window.
•Select Edit>Paste (Ctrl + V) and Click OK to the Replicate option to add the Level molecule structure and equations to your model.
•Save your model.
We are going to rename the molecule structure so that it represents the model of interest.
•Select the Variable tool (in the sketch tools bar).
•Click once on the variable Level. An editing box opens. Delete the word Level, type in Inventory and press Enter. Click once on the variable Increasing Quantity. Delete it, type in production and press Enter. Click once on the variable Decreasing Quantity. Delete it, type in shipments and press Enter.
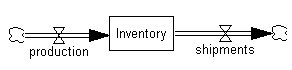
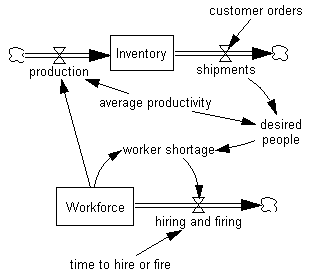
Your diagram should now look like:
NOTE: When you changed the variable names, the underlying equations were automatically changed to reflect the new names.
Modifying Equations
In order to simulate the model, we need to add and modify the equations to reflect the changes made. No change was made to the equations in this molecule. However, this molecule has the units for time of year; our model has units for time of month (the default in the Model>Settings>Time Bounds box). We will need to change units of measurement from years to months for variables throughout the model. (Although if we wanted the model to run in years, we could change that by selecting Model>Settings>Time Bounds and changing from months to years.)
•Select the Equation Editor in the sketch tool bar.
•Click on production, change the units of measurement to widgets/Month, click on OK.
•Click on shipments, change the units of measurement to widgets/Month, click on OK.
Simulation
•In the runname box, type in a run name (e.g., inv1)
•Click the Simulate button
•Double click on Inventory to select it as the workbench variable, then click on the Graph or Causes Strip Graph tool.
You see the behavior of Inventory, staying at zero for the entire simulation (because it was initialized at zero and the inflow and outflow are both constant and exactly the same value).
Adding a Second Molecule
•Production is caused by a workforce producing goods.
•Press Ctrl + Tab to return to the Level molecule. Select File>Close to close the molecule (or exit the window with the close button in the upper right window corner).
•Double click on the molecule Workforce.
•Drag a box over the molecule so the entire structure is highlighted (but leave out the text titles).
•Select Edit>Copy (Ctrl + C).
•Press Ctrl + Tab twice to get to the inventory model.
•Select Edit>Paste (Ctrl + V)
•Click OK to Replicate.
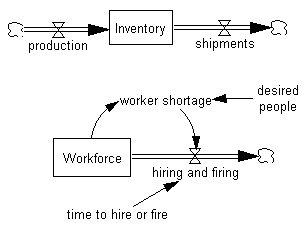
The Workforce molecule is added to your model. The molecule will probably cover some of the existing structure.
•While the molecule is still highlighted, move the Hand tool to the center of the highlighted structure, hold down the left mouse button, then drag the molecule away from the existing structure (in this case, drag it down). Click the mouse button with the pointer outside of the highlighted structure (or press Escape).
You should have the structure shown below.
Connecting Molecules
We need to connect the two molecules together to form a complete simulation model. Causal structure needs to be added between the molecules, and we might need additional variables. Equations need to be appropriately modified to reflect the changes in structure, and changes in units of measurement.
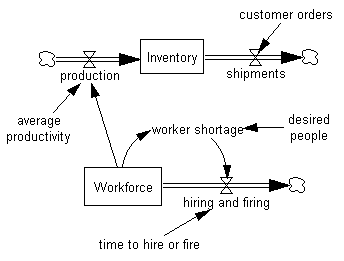
Workers produce goods. The average worker in the workforce builds a certain number of goods per amount of time spent working. This concept is represented by adding a variable called average productivity. The level of Workforce works at an average productivity to generate production. The amount of shipments is caused by an amount of customer orders.
•Select the Variable tool. Click on the sketch below the rate production (and left of the Workforce structure). Type in the name average productivity and press Enter.
•Click on the sketch above the rate shipments. Type in the name customer orders and press Enter.
•Select the Arrow tool. Click once on Workforce and then once on production.
•Click once on average productivity and then once on production.
•Click once on customer orders and then once on the valve attached to shipments.
Now the two molecules are causally linked together, forming one model. The structure of the model should appear as below:
Modifying Equations
In order to simulate the model, we need to add and modify the equations to reflect the changes made.
•Select the Equation Editor.
•Click on shipments. Delete the number 10 then click on customer orders in the inputs list. The equation should now appear as:
shipments = customer orders
| Units: widgets/Month |
•Click on customer orders. Add an equation with a STEP function, and add units, as below:
customer orders = 10 + STEP(5, 10)
Units: widgets/Month
This equation returns a steady order stream of 10 widgets per month until Time = 10 months, then a step increase of 5 is added, for a total order stream of 15 widgets per month.
•Click on Inventory. The initial inventory is currently zero. Change this to 50 widgets, keeping the rest of the equation, as below:
Inventory =
INTEG( +production - shipments
Inital Value: 50
Units: widgets
•Click on the Supplementary checkbox for Inventory (on the left hand side) to mark this as a variable not currently used anywhere in the model.
•Click on production. Delete the number 10. Click on Workforce in the inputs list, add a multiply sign ( * ), then click on average productivity in the inputs list. The equation should now appear as:
production = Workforce * average productivity
| Units: widgets/Month |
•Click on average productivity. Add the equation, and units, as below:
average productivity = 0.1
Units: widgets/Month/person
The inventory structure is now complete. Although the workforce structure has no black highlights (that would indicate missing or incorrect equations), some equations and units of measurement need to be modified.
•Click on Desired People. Keep the current value of 100, change the units of measurement to person, as below:
DesiredPeople = 100
Units: person
•Click on time to hire or fire. Change the constant value to 6. Change the units of measurement to Month, as below:
time to hire or fire = 6
Units: Month
•Click on Workforce. Change the units of measurement to person.
•Click on Worker Shortage. Change the units of measurement to person.
•Click on Hiring and Firing. Change the units of measurement to person/Month.
Make sure that your model has the correct formulation (syntax) by:
•Select Model>Check. Model (Ctrl + T)
A message box should appear saying that your model is OK. If your model has syntax problems, the Equation Editor will open at the (first) equation displaying a problem.
Make sure that your model has the correct units of measurement by:
•Select Model>Check Units (Ctrl + U)
A message box should appear saying that your model is AOK. If the units do not match, an output box will appear describing the problems in equations and their units of measurement.
Simulation
•In the runname box, type in a run name (e.g., inv2)
•Click the Simulate button
•Double click on Inventory to select it as the workbench variable, then click on the Graph or Causes Strip Graph tool.
The behavior of Inventory is irrational. The first 10 months has the equilibrium value of 50 widgets, but then Inventory falls and becomes highly negative. Clearly we are missing some feedback. We need to increase production to retain our Inventory and we do this by raising the number of workers in the Workforce. The size of the Workforce is driven by Desired People, and that needs to be driven by shipments, which will signal when we need the increase.
Adding Feedback to Molecules
•Select the Hand tool and bring average productivity to the center of the model.
•Select the Arrow tool and make connections from average productivity to Desired People and from shipments to Desired People, as shown below:
•Select the Equation Editor tool on the sketch tool bar.
Only the variable Desired People should be highlighted.
•Click on Desired People, change the equation to:
DesiredPeople = shipments / average productivity
Now as shipments increase, the variable Desired People will also increase, and after a delay, Workforce will increase, raising production and increasing Inventory.
•Select Model>Check. Model
•Select Model>Units Check
Simulation
Click the Control Panel button and select Datasets. Double click on the run names appearing in the left hand box (inv1 and inv2). This will unload the previous two runs so that the analysis tools will only operate on the current run.
•In the runname box, type in a run name (e.g., inv3)
•Click the Simulate button
•Double click on Workforce to select it as the workbench variable, then click on the Graph or Causes Strip Graph tool.
At Time = 10, Workforce shows a steady increase to a new value, compensating for the increase in customer orders. The behavior of Inventory is now improved, although a problem still exists. Inventory falls and stays constant at a lower level than before. More feedback is needed to compensate for the falling inventory level. For further information, see the Workforce/Inventory models wfinv1 and wfinv2 released with the Vensim® software.
Other Molecule Operations
Building models using molecules requires some knowledge of Vensim's graphical interface. A few simple operations are described below.
Replication
When a molecule (or a portion) is inserted into a model, the menu item Edit>Paste (Replicate) is used to create new variables, structure and equations. Do not select Edit>Paste (Picture) to insert molecules because you will only get a picture of the molecule, not variables, structure or equations. If a variable exists in the model that has the same name as a variable being inserted, the molecule's variable will be renamed. For example, if Workforce already exists, a molecule containing this name will be renamed Workforce 0.
Deleting or Merging Structure?
Adding two or more molecules may introduce more structure than you need. If the structure is redundant, you need to delete it. Use the Delete sketch tool (Pacman), or highlight it with the pointer and select Edit>Cut, and choose Delete variables….
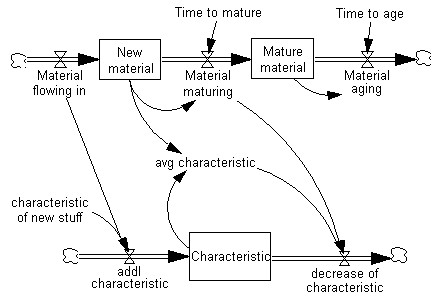
In the diagram below, we have inserted a portion of the molecule Cascaded Delays Or Aging Chain, then inserted a Coflow molecule below it. (The flow out from Material aging needed to be redrawn to a cloud using the Rate sketch tool.)
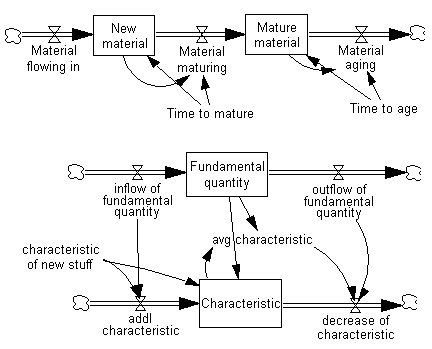
We want to replace the variable Fundamental quantity with the variable New material; and replace the inflow and outflow of fundamental quantity with Material flowing in and Material maturing. In this way, we can build a coflow to determine the average characteristic of the New material.
Because the stock and flow structure is the same, we can either merge the structures, or delete one and use the other. For this example, we choose the latter method. First, to preserve our knowledge of the causal connections, we will add connecting arrows from the structure we want to keep, while still retaining the structure that we are going to replace.
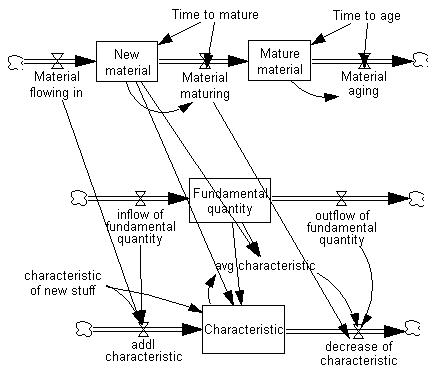
Next, the unnecessary structure will be deleted. Either use the Delete sketch tool or highlight the three variables (and clouds) and use Edit>Cut and choose Delete Variables…. Now we have a coflow representation of new material that is flowing through an aging chain.